6.1. Intro
6.1.1. Overview
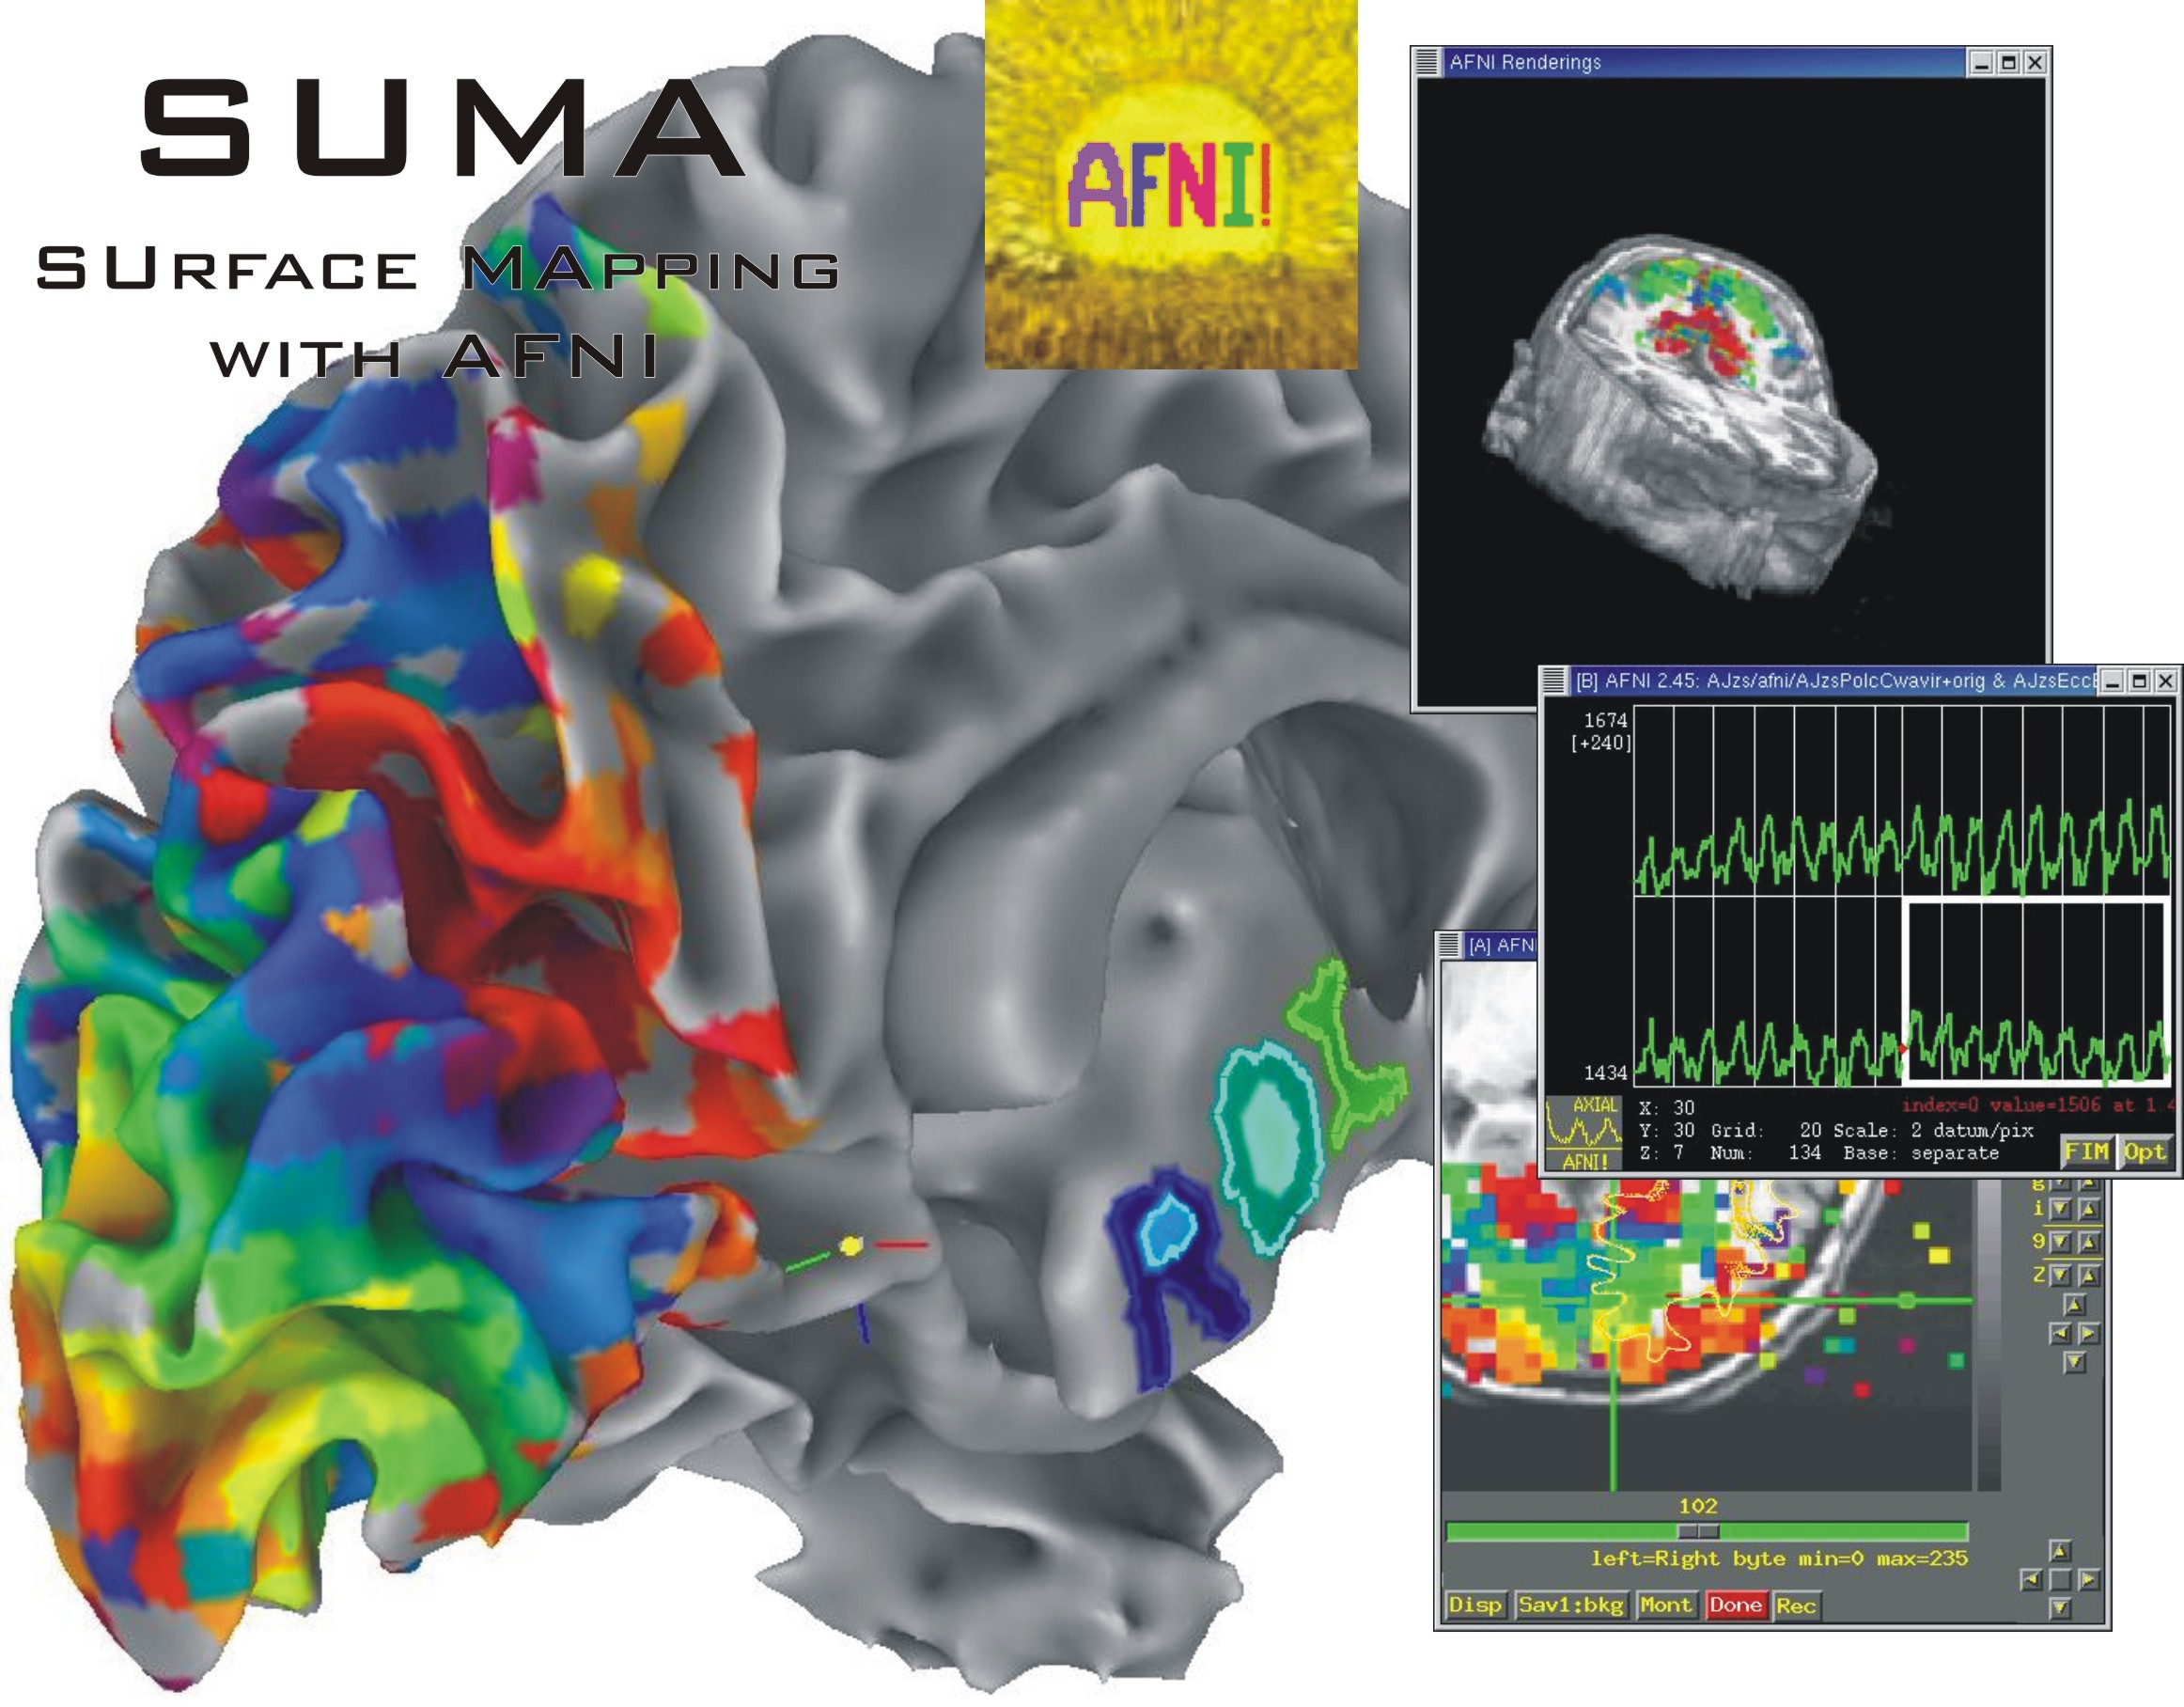
SUMA is a program that adds cortical surface based functional imaging analysis to the AFNI suite of programs https://afni.nimh.nih.gov . SUMA allows 3D cortical surface renderings, the mapping of volumetric data onto them and, surface based computations and statistical inferences. In addition allows rendering and manipulation of tractography results, connectivity graphs/matrices, and volumes.
|
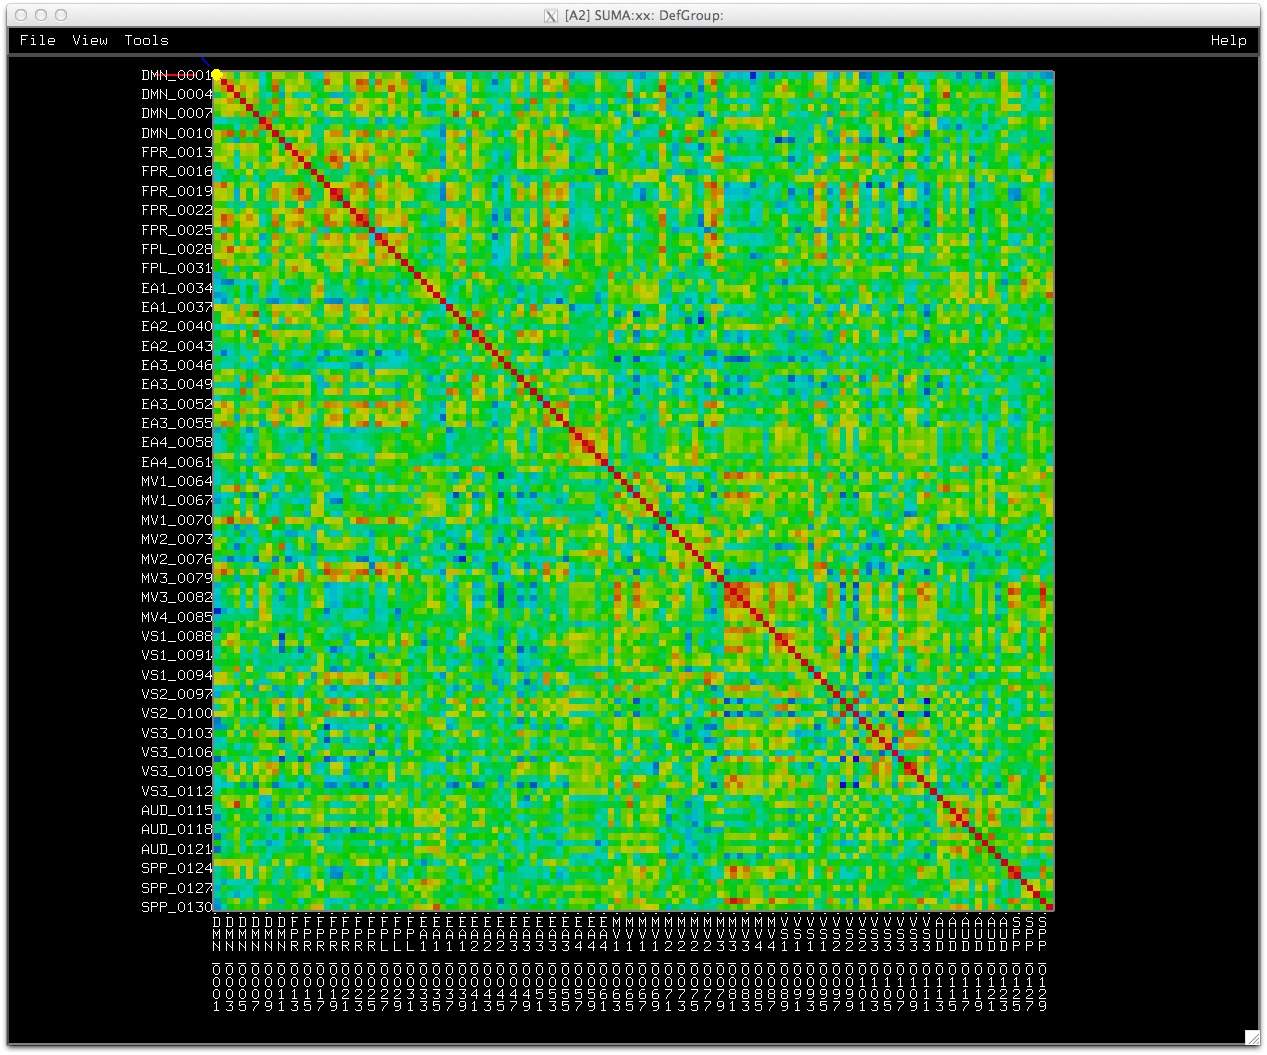
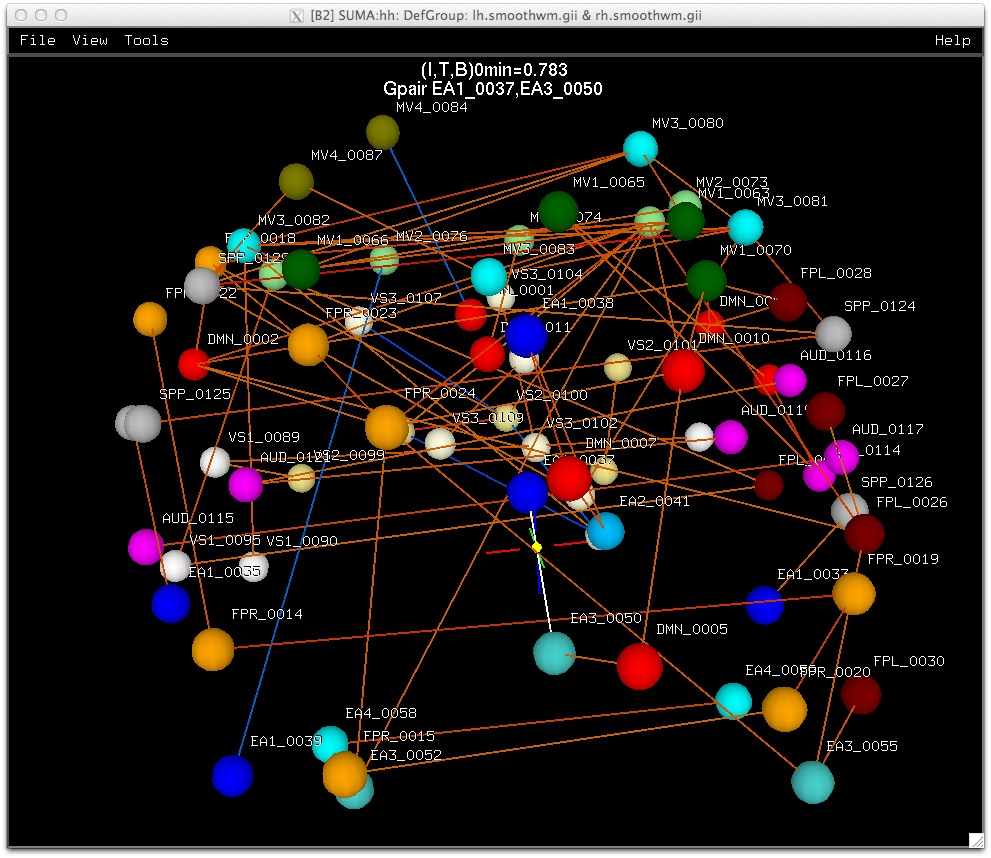
SUMA also allows display and manipulation of matrices for various flavors of connectivity data, tractography results from AFNI’s FATCAT toolbox, and the rendering of volumetric data. |

|
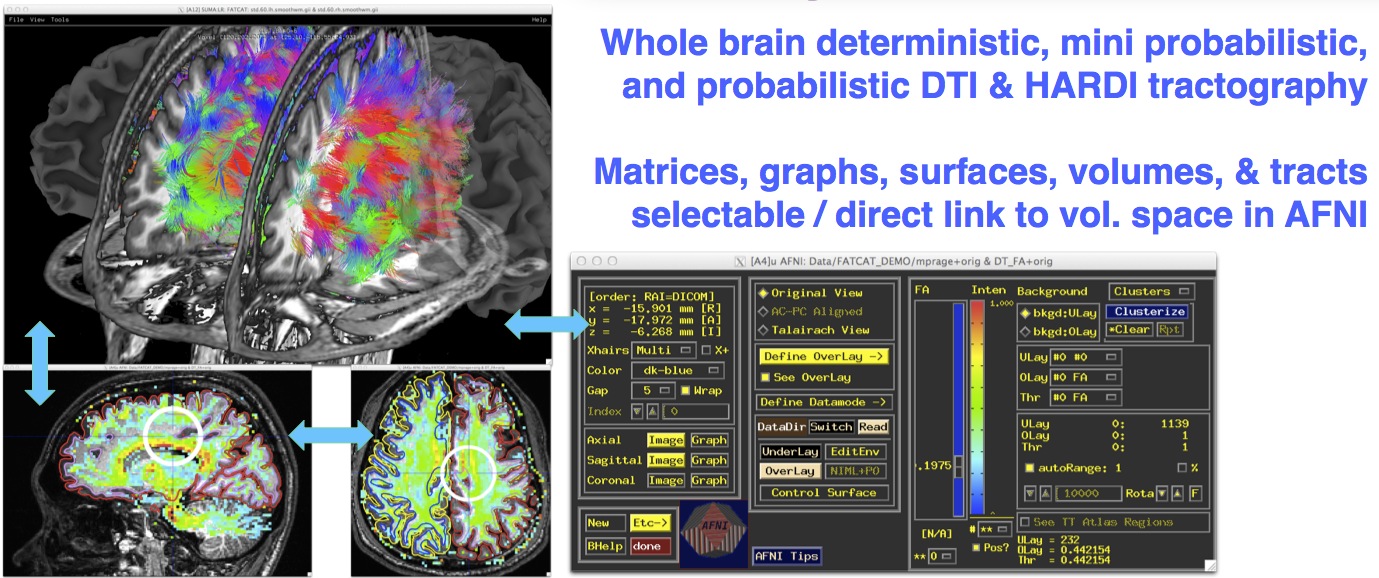
Whole brain deterministic tractography with AFNI-FATCAT as rendered with SUMA. Surface models, here shown with transparency, are pried apart to reveal internal structures. |
|
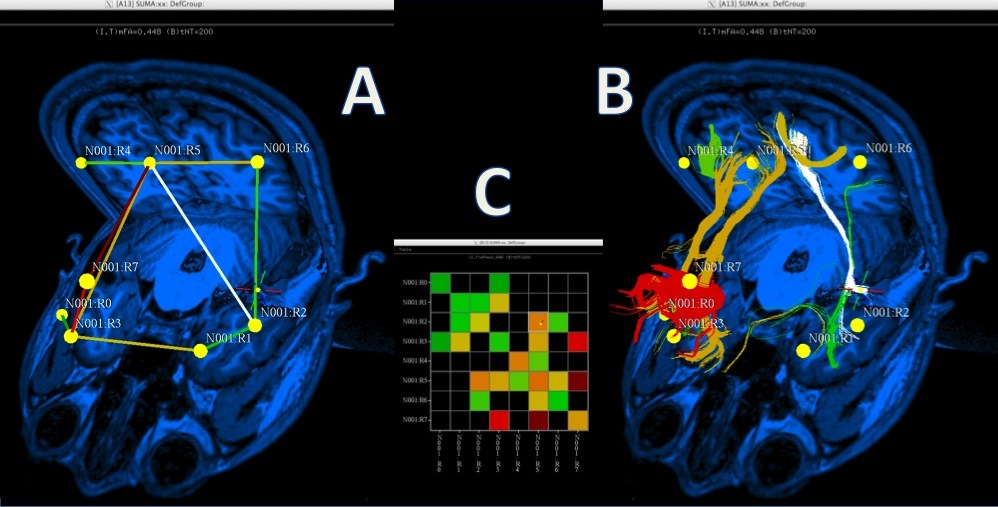
A. Rendering of matrix data as a 3D graph.
B. Graph edges represented by bundles.
C. Matrix representation of connectivity data.
|
6.1.2. Highlights
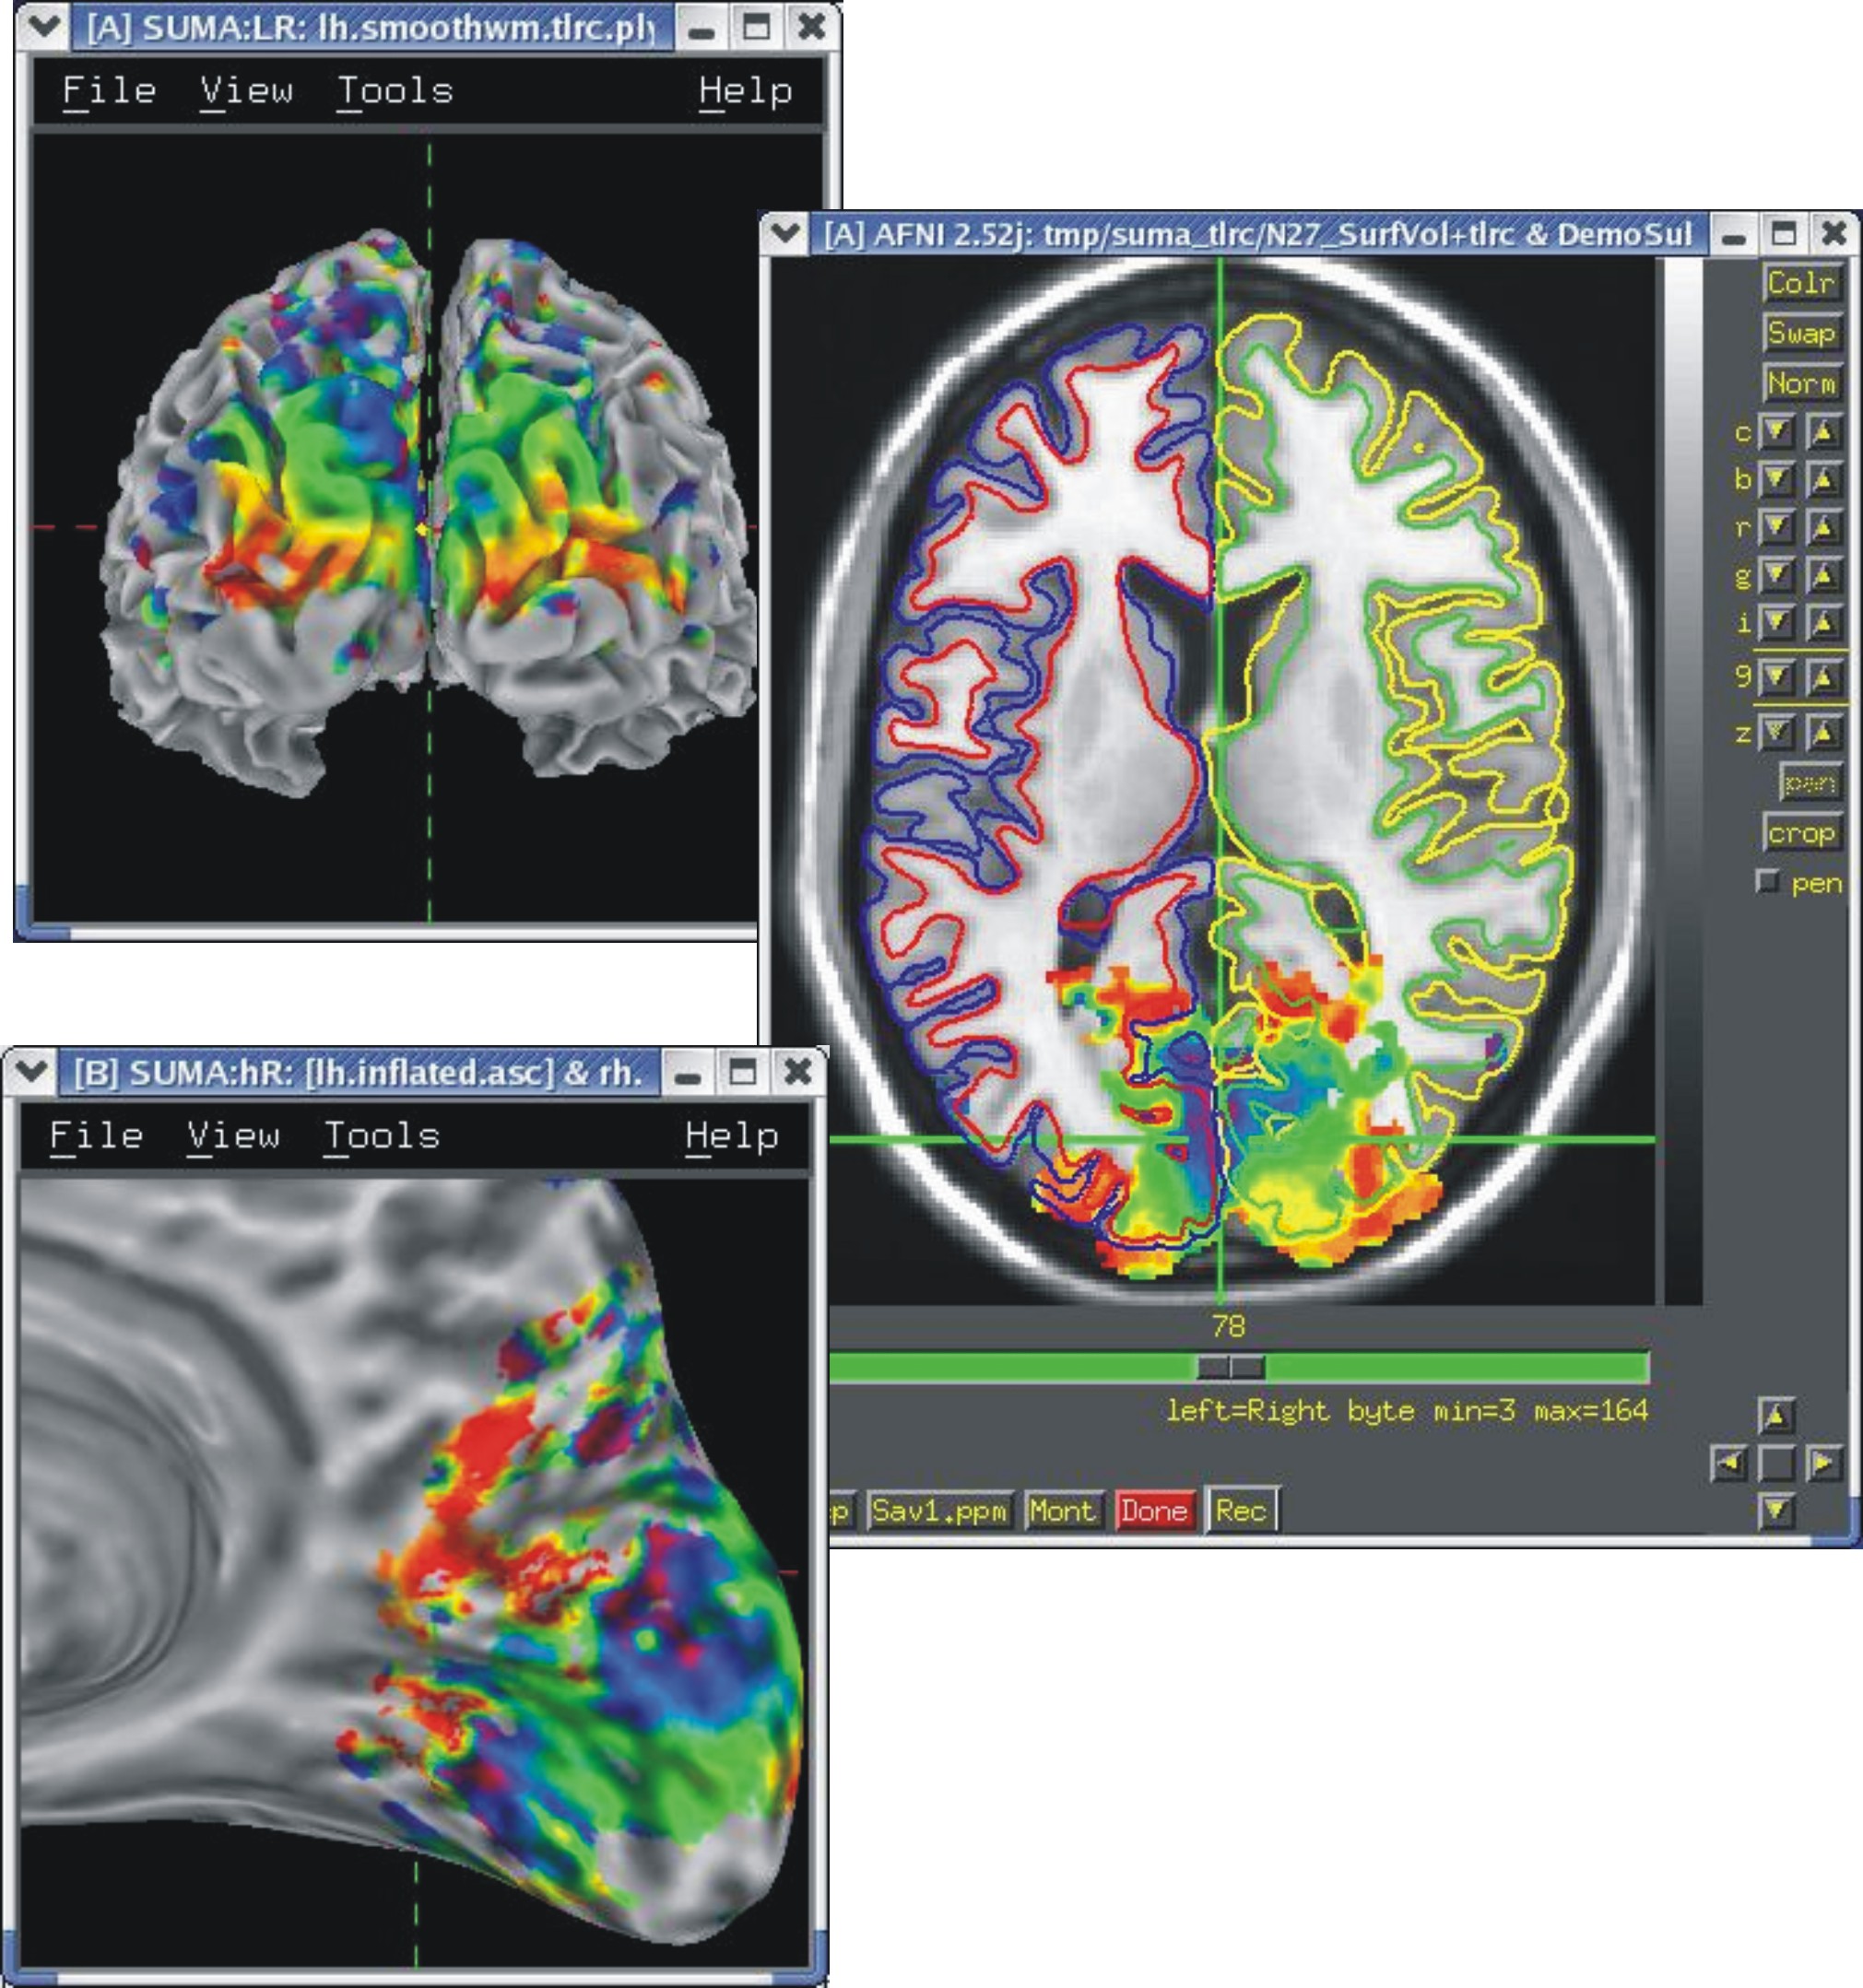
Multimodal rendering with direct AFNI link
|
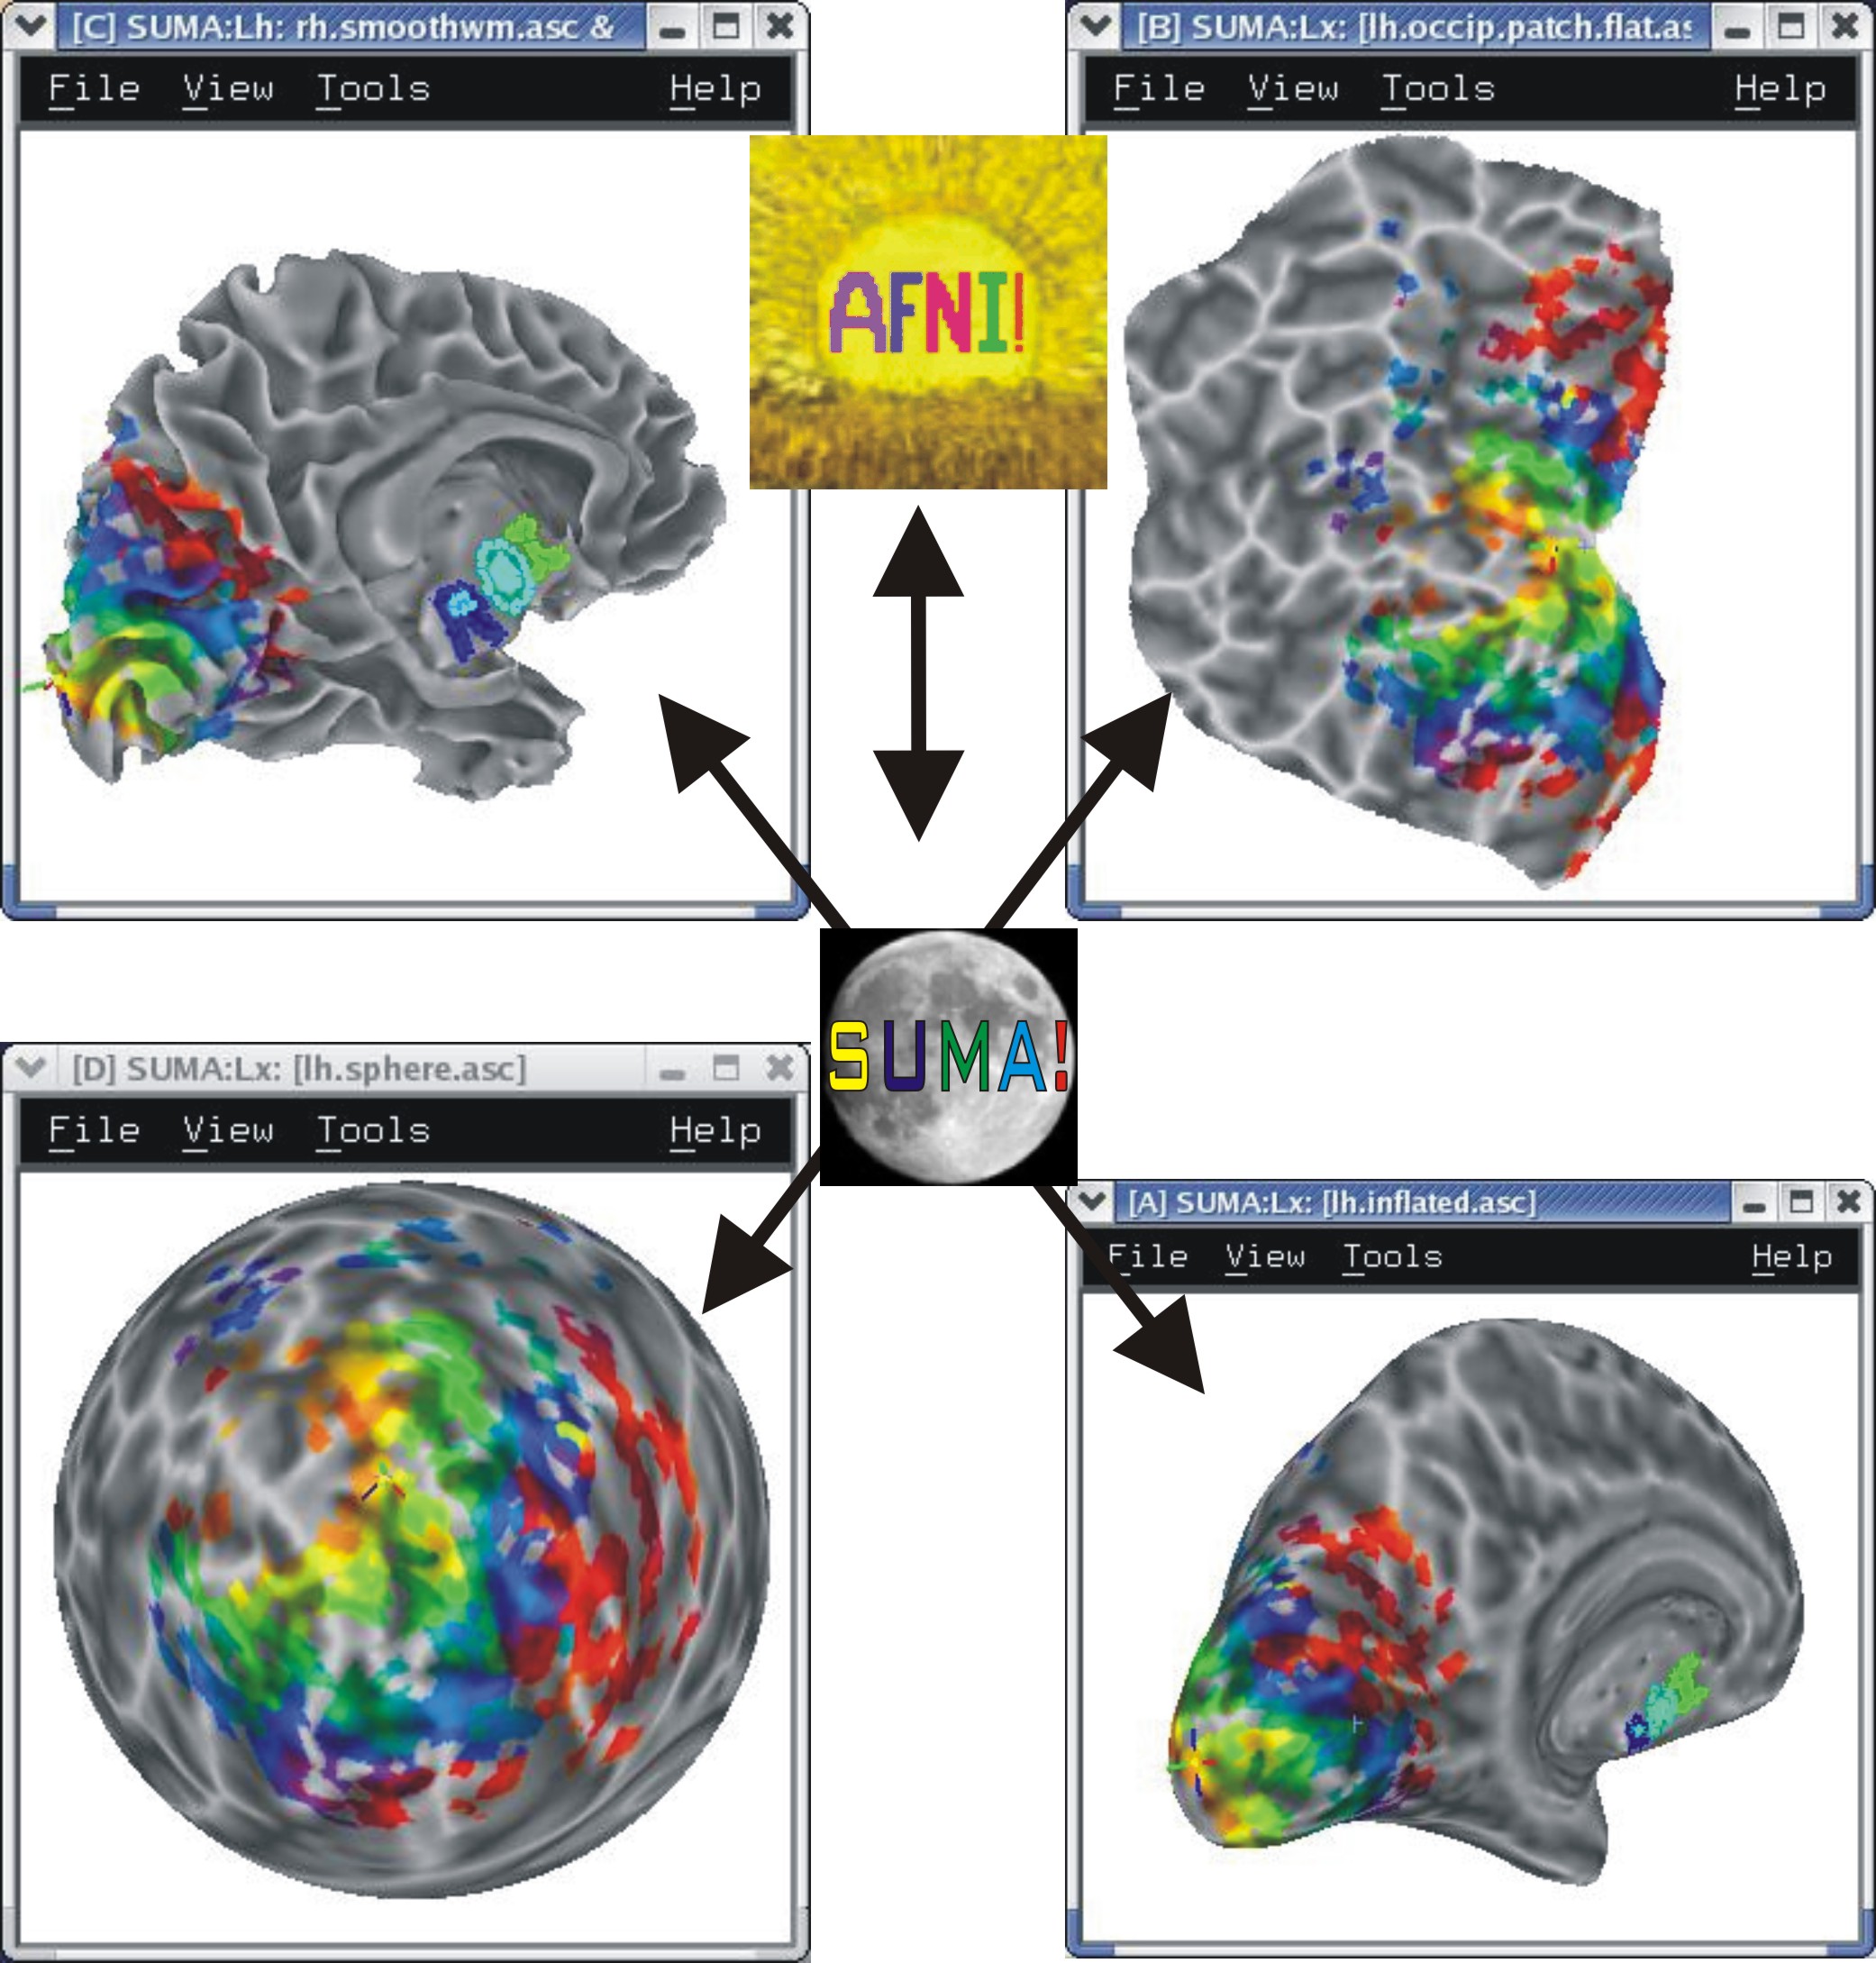
Multiple Linked Viewers
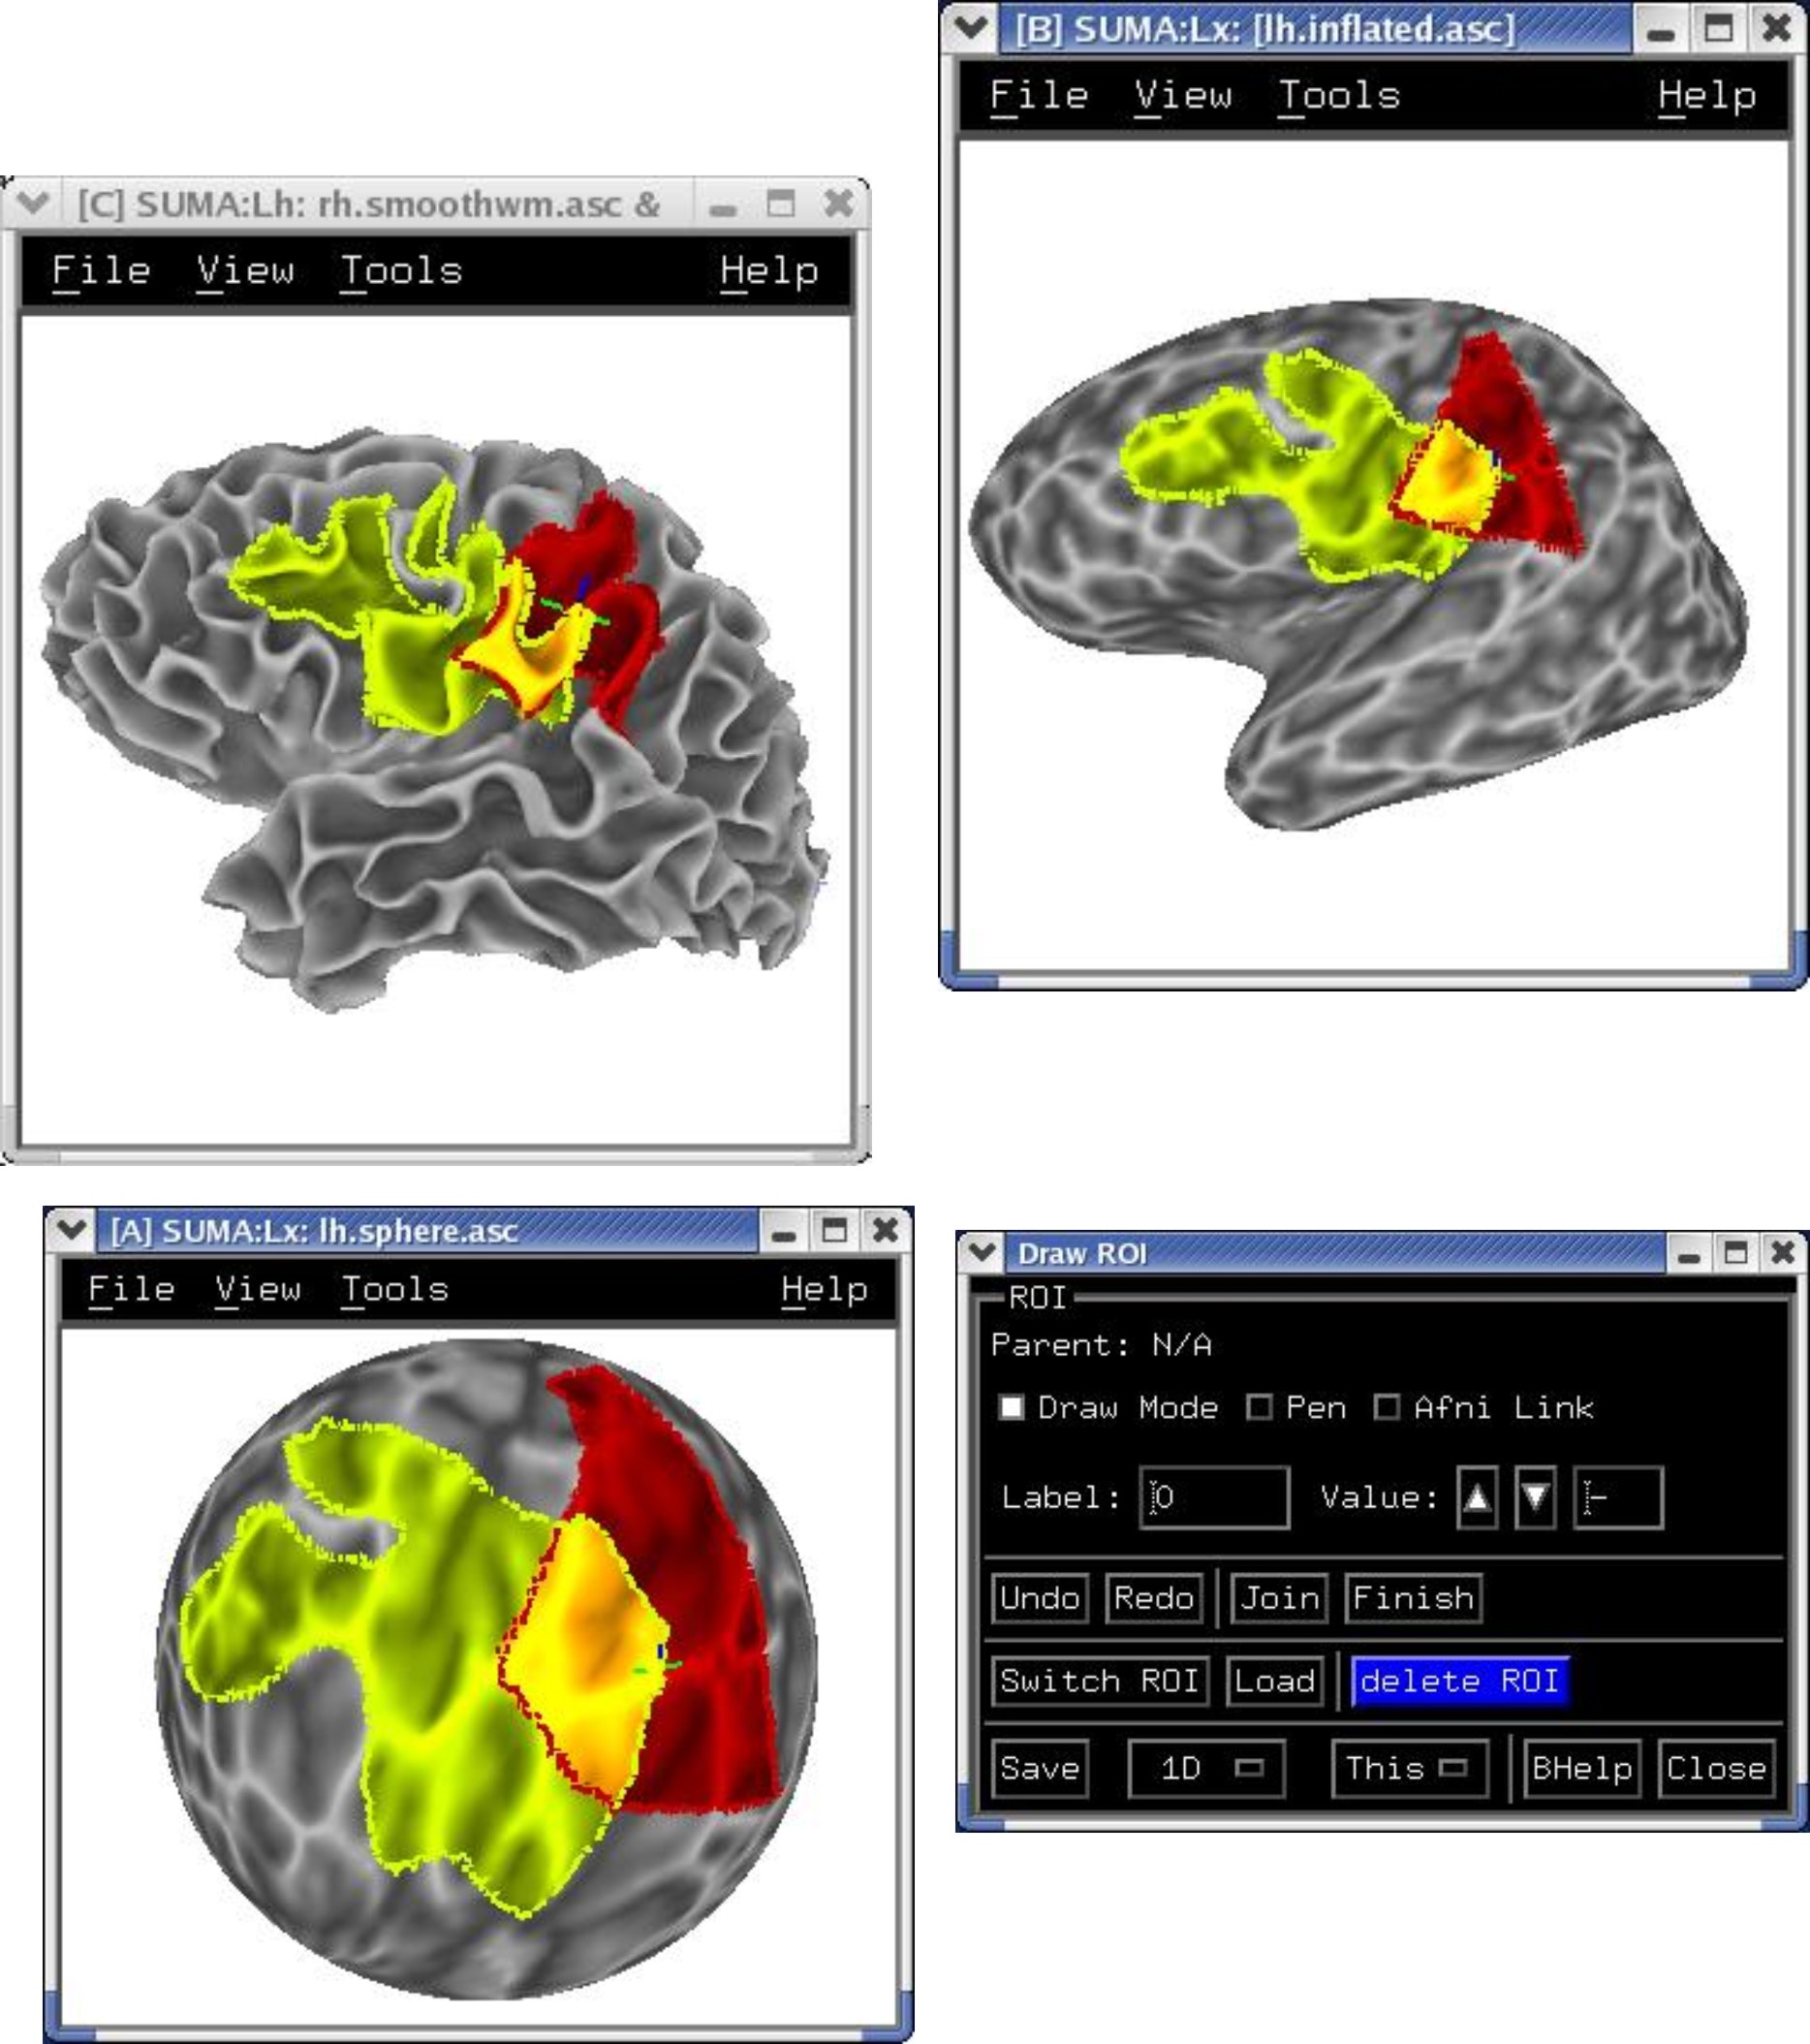
You can have up to 8 linked surface viewers open simultaneously.
|
ROI Drawing
Freehand ROI drawing in any viewer. See Drawing ROIs.
|
Simultaneous, yoked left/right hemisphere display
Most actions, such as dataset loading and parameter settings on one hemisphere are automatically carried out on the other hemisphere.

|
Templates of standard-space volumes in MNI and TLRC
If your volumetric data are in Talairach space, you can display them on these surfaces.
See Template Surfaces for details on obtaining the surfaces.
|
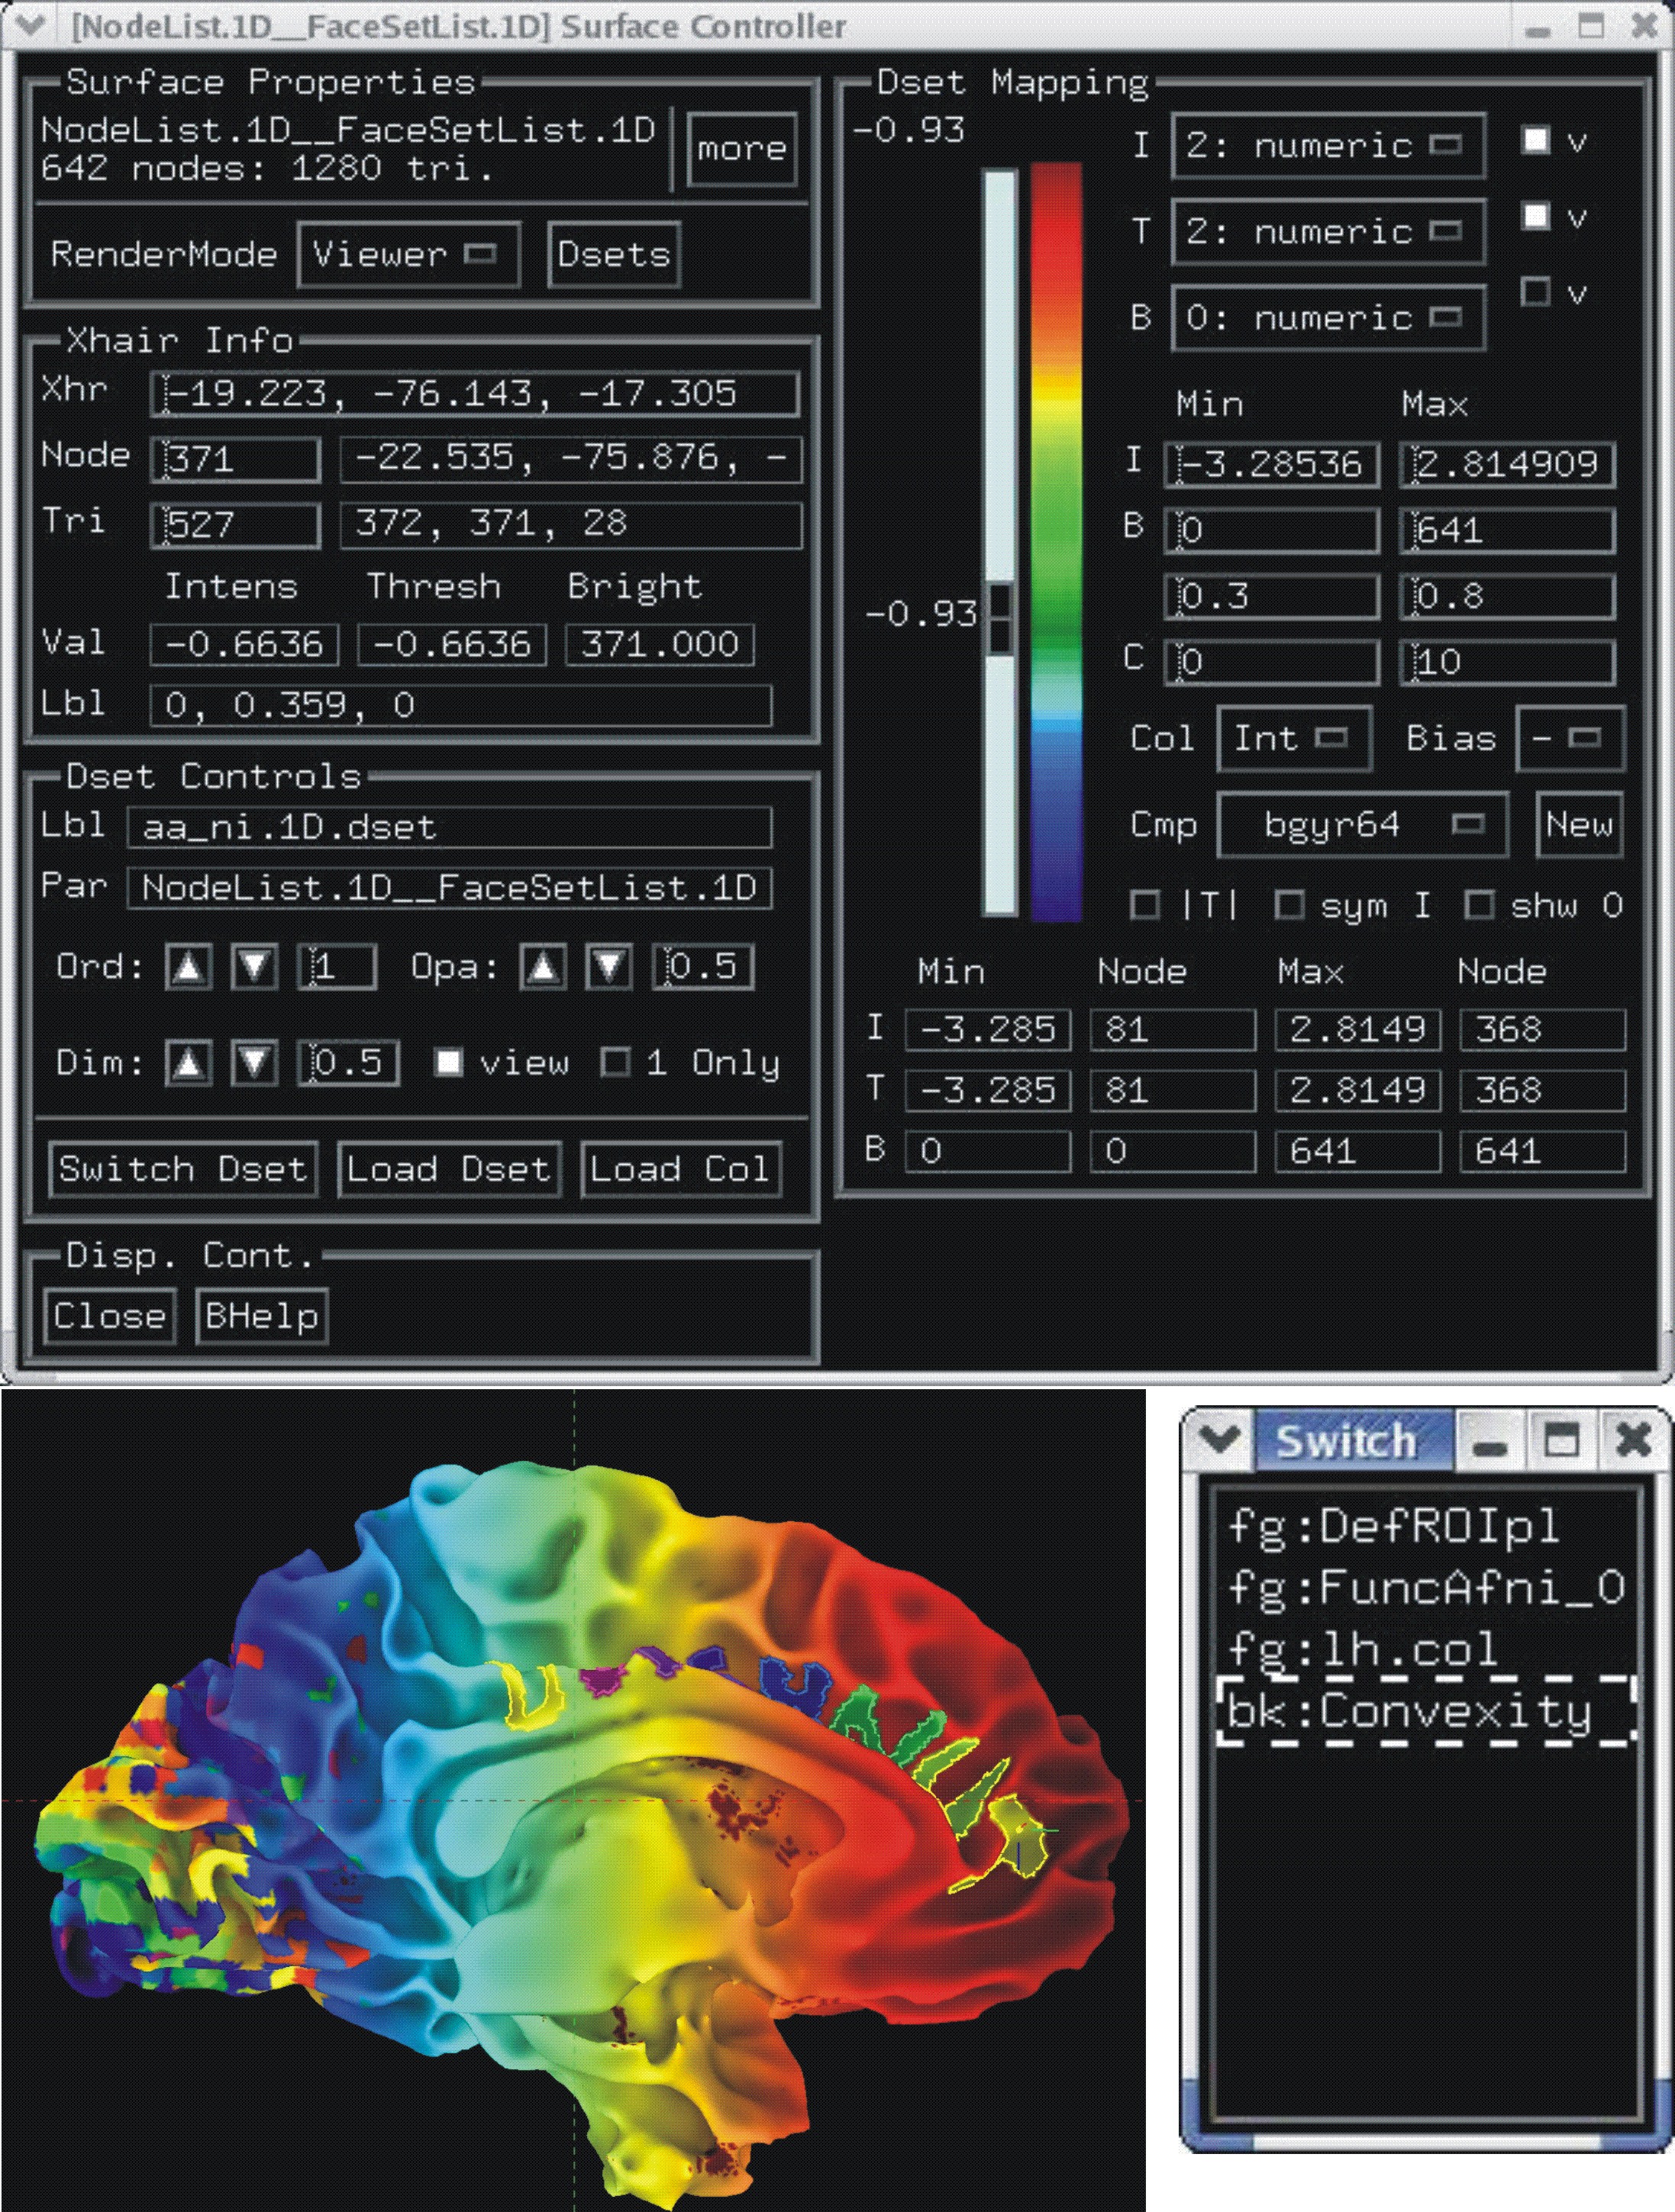
Multi-dataset color mapping (+ layering and opacity controls)
Each dataset is colored interactively using SUMA’s surface controller shown below. The color mapping of each dataset is stored in a separate color plane whose order and opacity can be controlled for each surface model.
Surface models with four stacked color planes consisting of the surface convexity, drawn ROIs, functional data from AFNI and a node color data file that looks cool.
|
Similarly, data coloring can be done for volumes, graphs, and connectivity matrices.

|
|
|
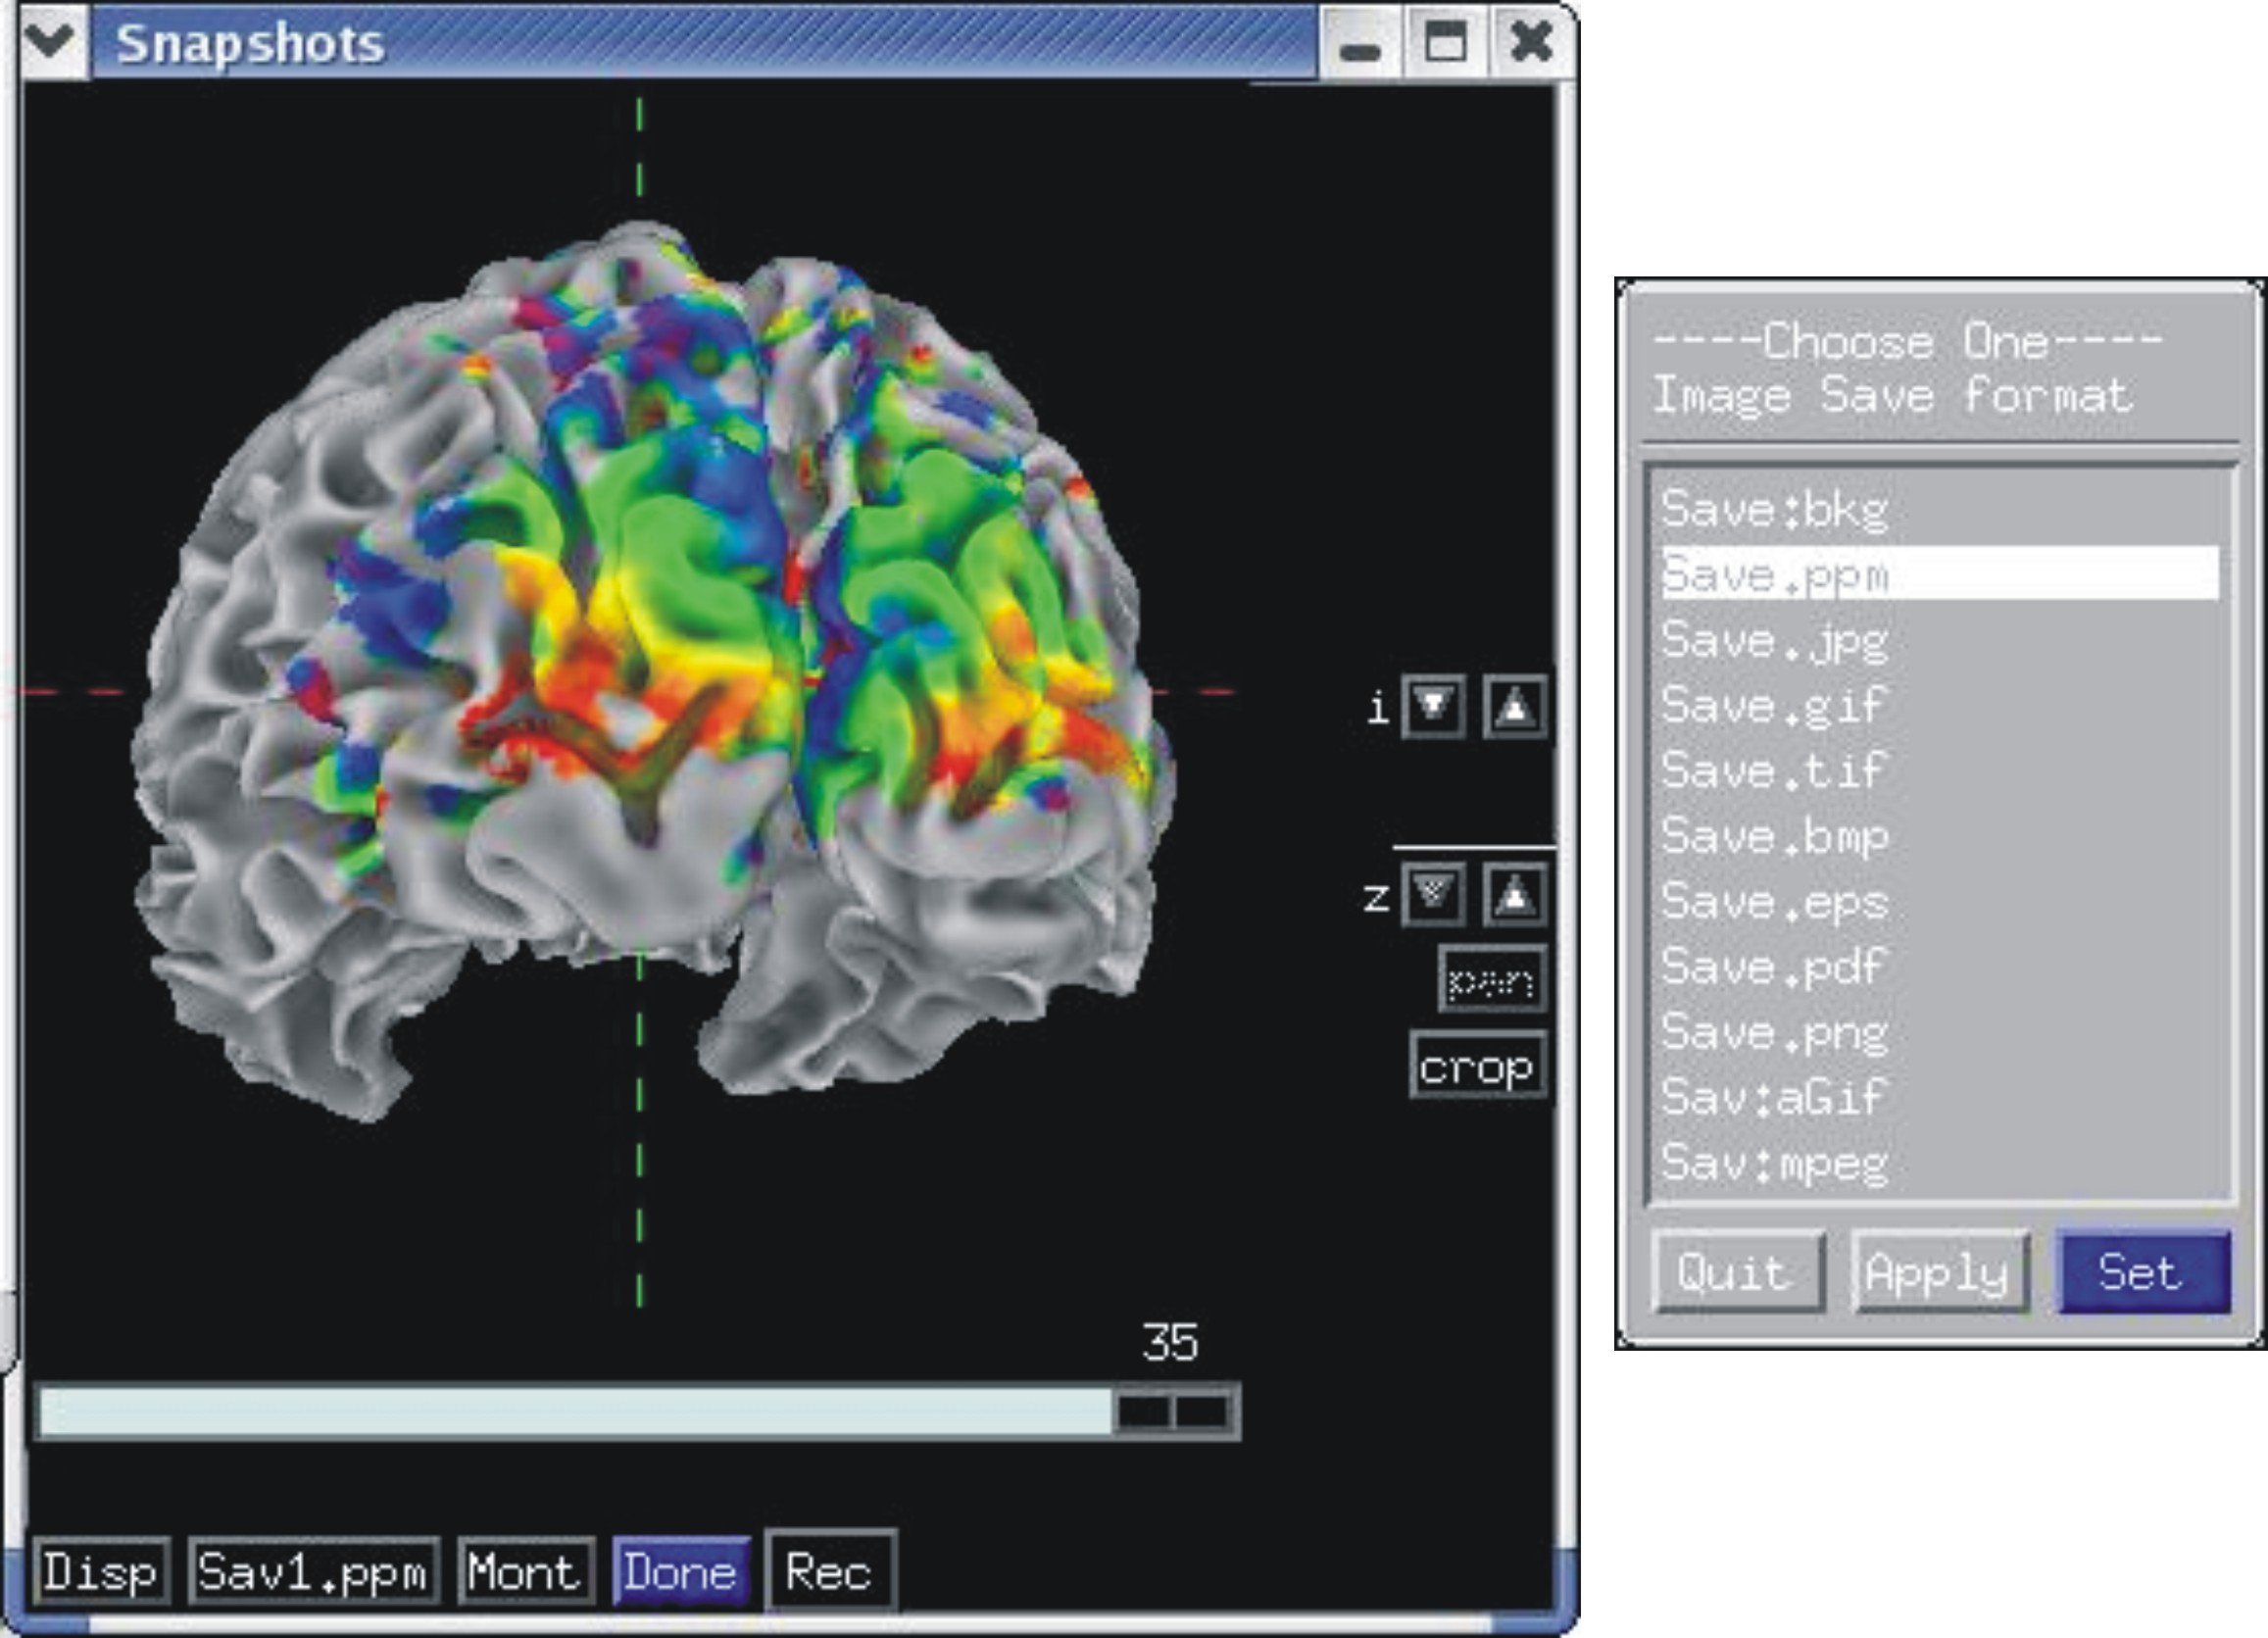
Recording in continuous and single frame mode
Rendered images can be captured by an AFNI-esque image viewers and saved into all formats provided by AFNI, including animated gifs and mpegs. Saving can also be done directly to disk.
|
Automation of GUI behavior
You can automate the majority of tasks normally performed interactively. See demo scripts @DriveSuma, @DriveAfni, and @DO.examples available in the AFNI distribution.

|
Illustration for driving SUMA’s GUI from the command line with DriveSuma. The example here illustrates the functioning of a script that automatically generates a movie of MEG SAM data from 0 to 600 ms after stimulus delivery. (Data and script to generate this movie are courtesy of Chunmao Wang, and available here. |
A library of command line programs for batch processing
All voxelwise programs that make up the AFNI distribution will handle surface-based datasets. Operations such as smoothing and clustering that have their surface-based equivalent in SurfSmooth and SurfClust, for instance.
afni_proc.py, AFNI’s pipeline generating program, can directly
turn a volume-based analysis into a surface-based one with the simple
addition of two options.
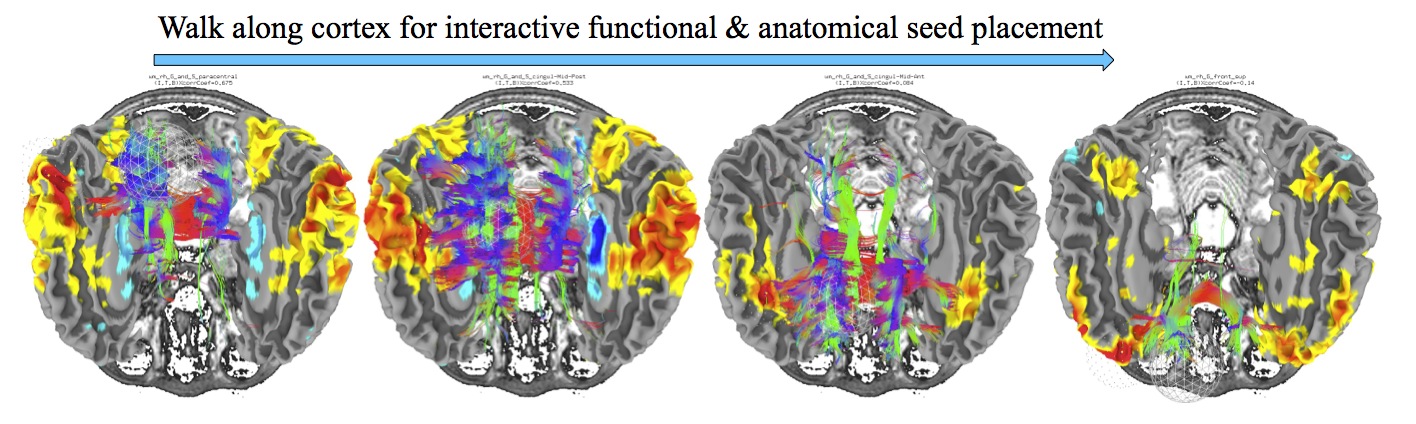
Interactive Functional and Anatomical Connectivity
Perform simultaneous, interactive functional and anatomical connectivity, all while maintaining a link to AFNI and original volumetric data. Use demo script Do_09_VISdti_SUMA_visual_ex3.tcsh which is part of the FATCAT Demo to walk through the process.
|