Conjunction Analysis
Suppose we are interested in finding out the overlapping regions in the brain among a set of contrasts. Those regions can be obtained through 3dcalc, a general purpose program for performing logic and arithmetic calculations.
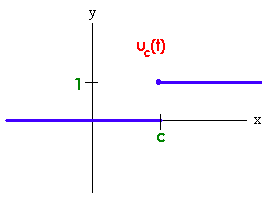
The pivotal part of this analysis is a special function called Heaviside Unit, or Step Function,


Some expressions of step function can be used to select voxels with values v meeting certain criteria:
- Find voxels where v > th and mark them with value=1
expression = step (v – th)
- In a range of values: thmin≤ v ≤ thmax
expression = step (v – thmin) * step (thmax - v)
- Exact value: v = n
expression = equals(v – n)
- Create masks to apply to statistical (t or F) sub-bricks: Two values both above threshold (e.g., active in both tasks; “conjunction”)
expression = step(v-A)*step(w-B)
- Voxels thresholded with two statistics (one with threshold value of A while the other with B).
1. Assume we would like to obtain the conjunction among 2 contrasts: A vs C, and B vs C.
3dcalc -a func+tlrc'[5]' -b func+tlrc'[7]' -expr 'step(a-4.2)+2*step(b-4.2)' -prefix cond_mask
The value 4.2 above is the threshold for those three statistics, and, if justified, it does not have to be the same across the contrasts. Interpretation for the result cond_mask+tlrc:
0 – not interesting;
1 - A > B;
2 - B > C;
3 - A > C and B > C.
Note: Only scenario 3 can be solidly presented as result. The others are only suggestive.
2. Assume we would like to obtain conjunction among 3 contrasts: A vs D, B vs D, and C vs D.
A > D ==> 1;
B > D ==> 2;
C > D ==> 4
Note: If you're curious why these mapping numbers of 1, 2, and 4 are chosen, they are basically 2 to the power of 0, 1, 2, .... As each contrast either is either above or below the threshold, the mapping corresponds to the representation of all the combinatorial results in binary system! With such weighting, each number in the output can be uniquely determined as one of the combinations.
(2) Create a mask with 3 t statistical subbriks (with a hypothetical t threshold of 4.2):
3dcalc -a func+tlrc'[5]' -b func+tlrc'[10]' -c func+tlrc'[15]‘ -expr 'step(a-4.2)+2*step(b-4.2)+4*step(c-4.2)' -prefix cond_mask
(3) There are totally 23 = 8 possible combinations (not necessarily all interesting) among the 3 contrasts:
Interpretation for the result cond_mask+tlrc:
0 – not interesting;
1 - A > D;
2 - B > D;
3 - A > D and B > D;
4 - C > D;
5 - A > D and C > D;
6 - B > D and C > D;
7 – A > D, B > D and C > D.
Note: Only scenario 7 can be solidly presented as result. The others are only suggestive.
* Back to Gang Chen's home page
Note: Only scenario 7 can be solidly presented as result. The others are only suggestive.
* Back to Gang Chen's home page


