12.11.4. Tab’s on me if you think I’m lyin’. [1]
And my script’s been rearranged. [2]
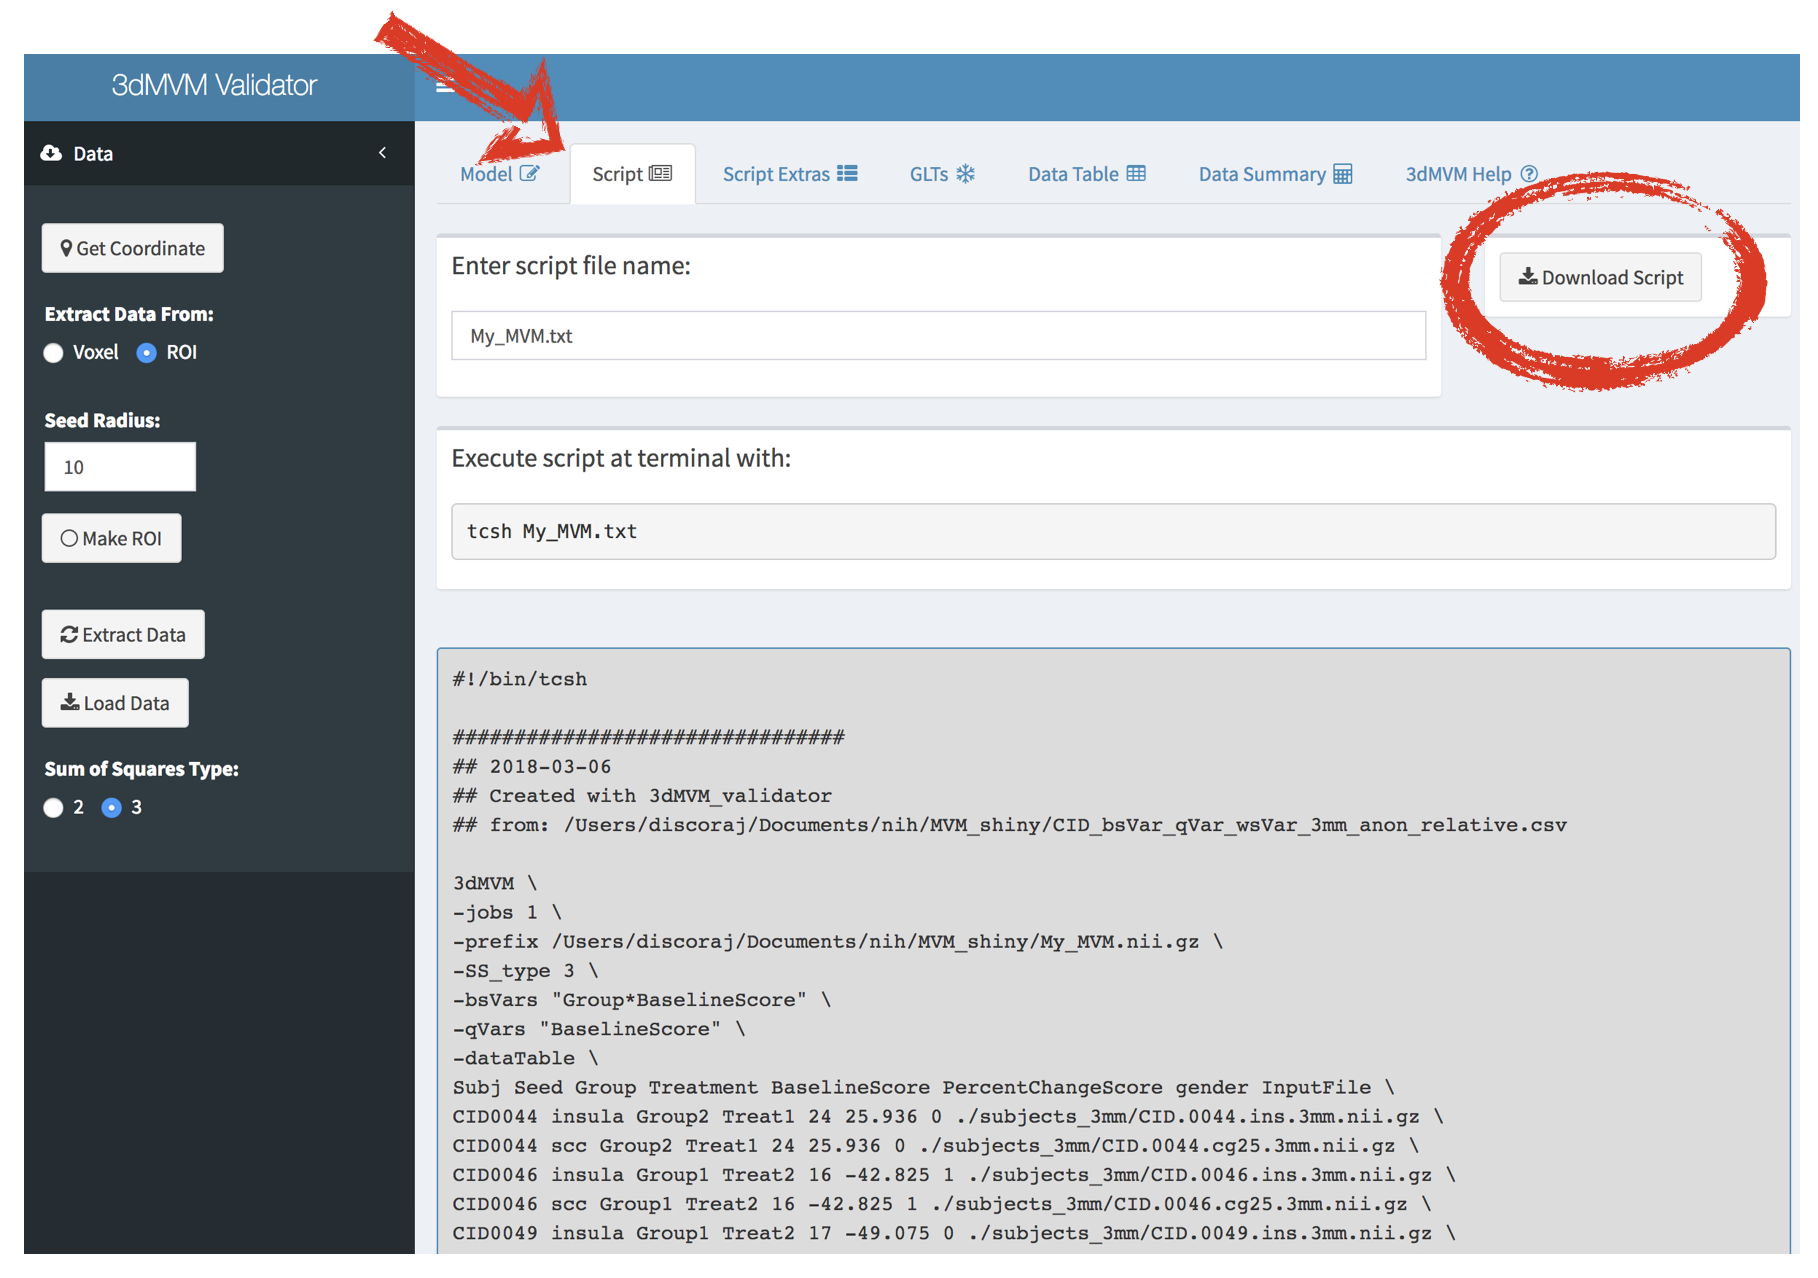
This tab shows the script that is created as you specify options. Every change and addition you make will be updated live in the script. You can download the finalized script here to run in the terminal. |
|
Warning
If you have relative paths (./ etc) in your data table, remember to run the script from the same location so the paths are correct!!
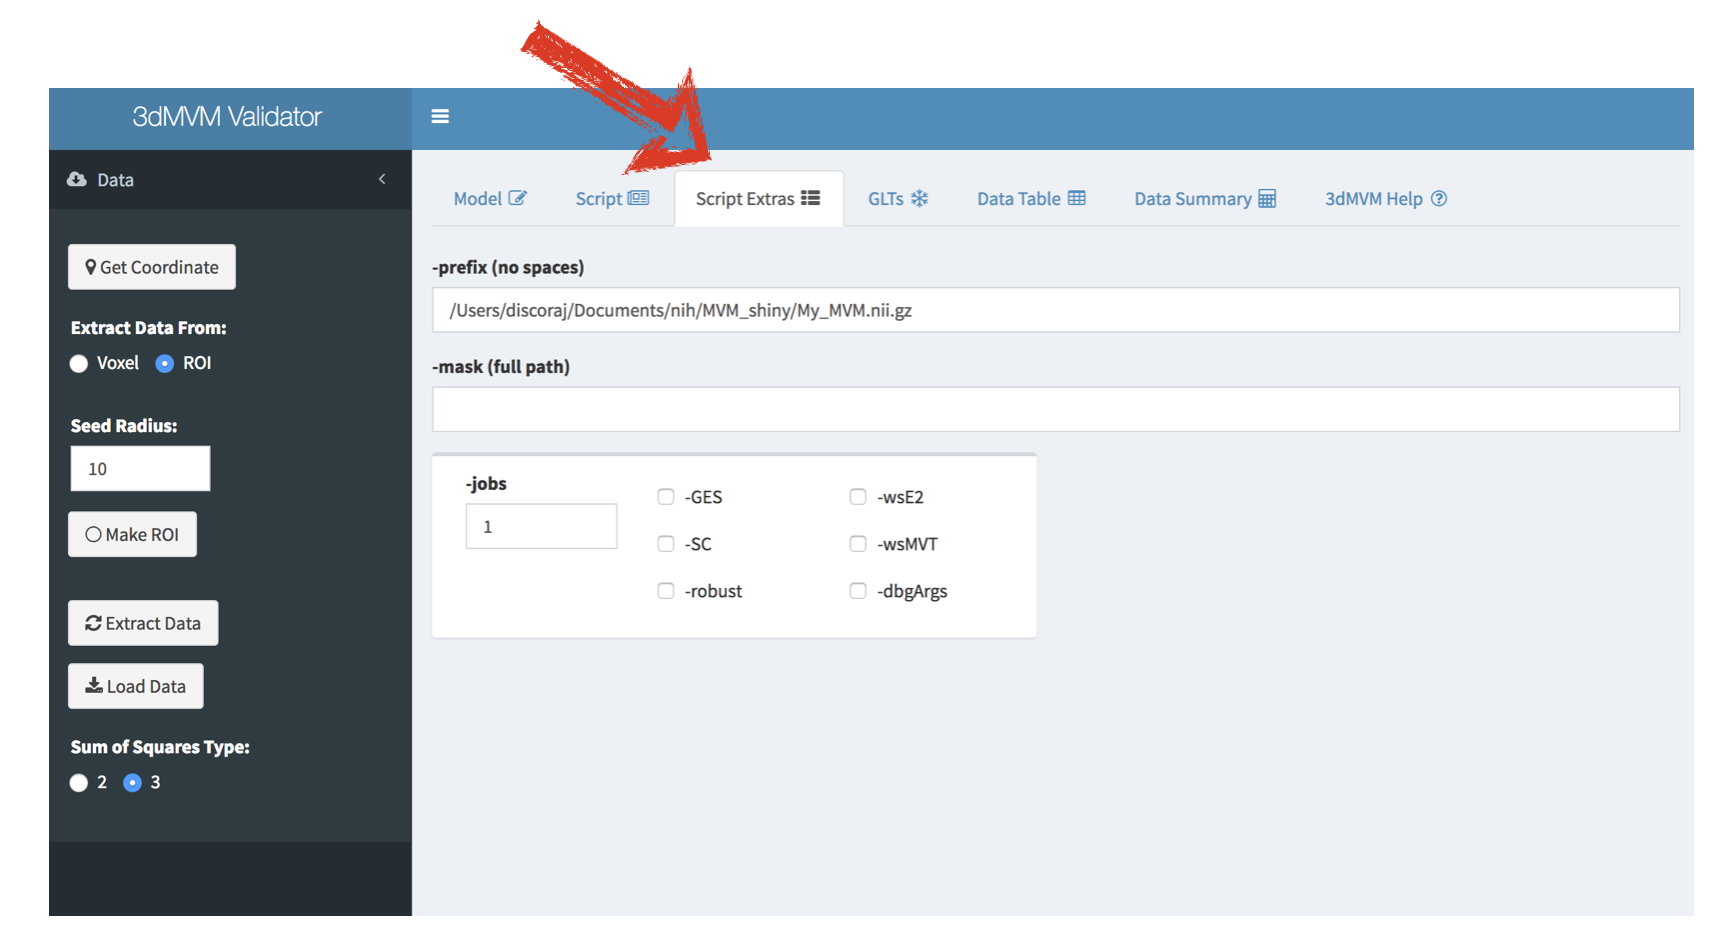
This tab shows the script extra options to be added to the script. The options are explained in the help for 3dMVM. Selections here will also update on the script tab. |
|
What is your data? [3]
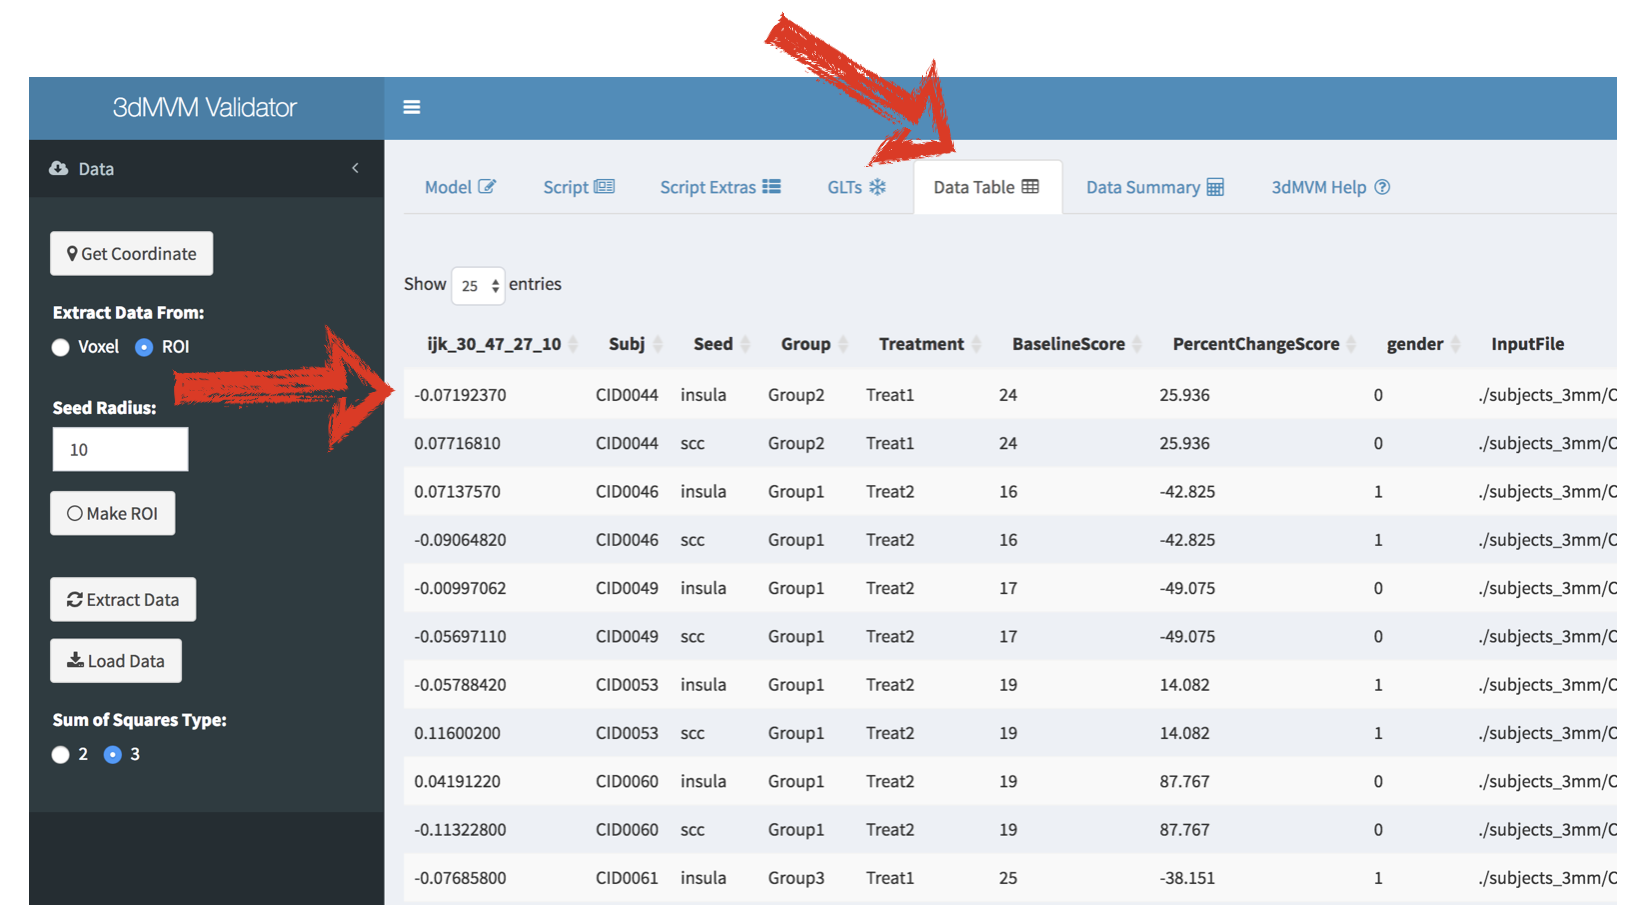
The Data Table tab shows the all of your data table plus the data extracted from the voxel or ROI that you selected. Here the “ijk_30_47_27_10” is the center coordinate with the radius 10. And the values are what was extracted from each dataset. |
|
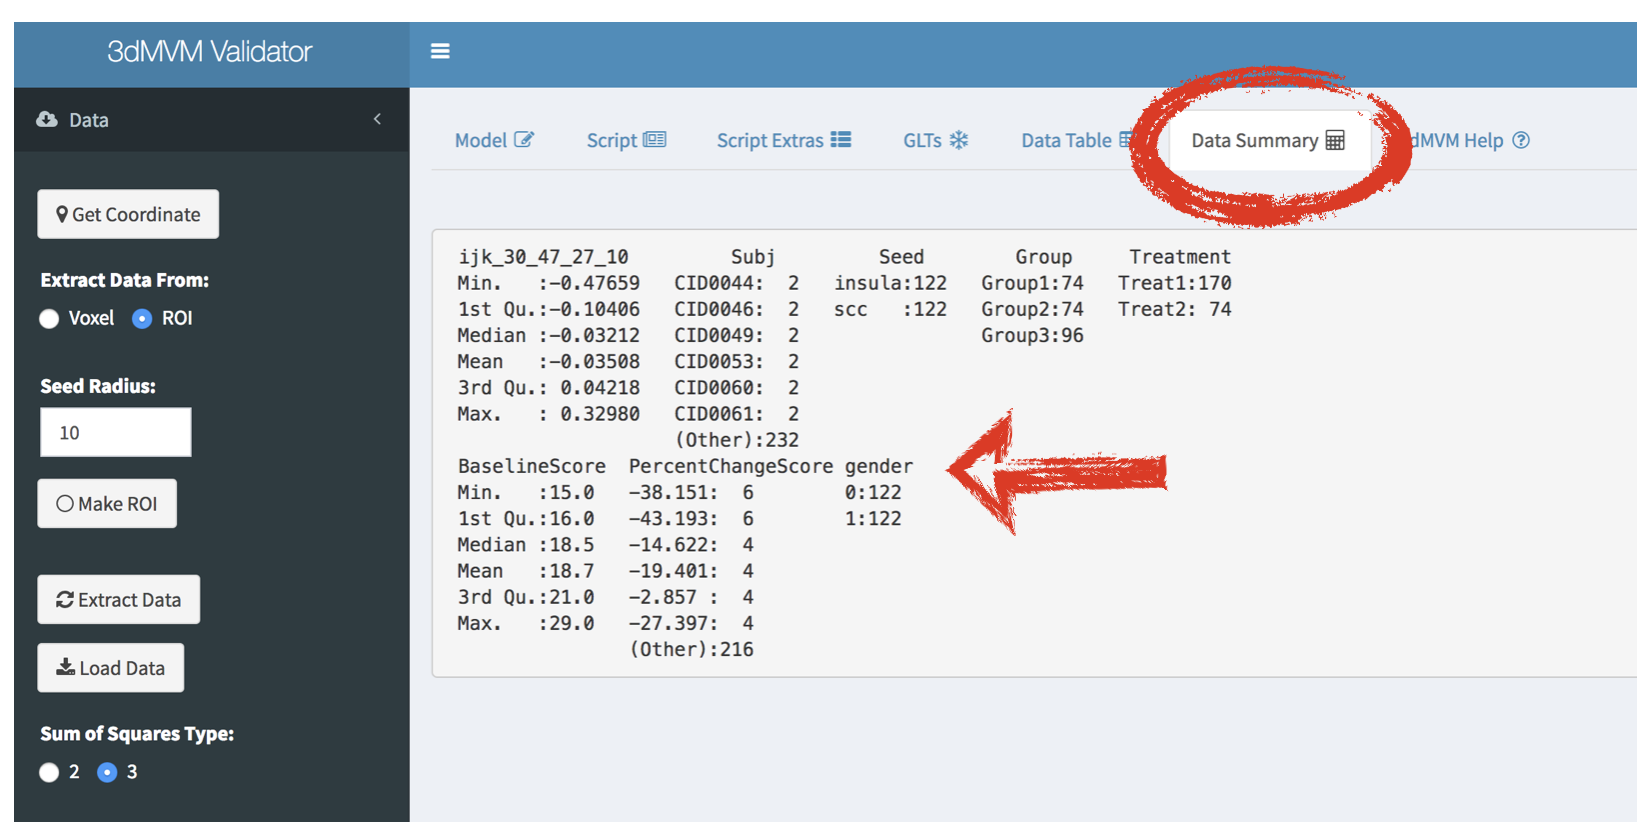
The Data Summary tab shows a quick look at some basic descriptive statistics of your data. Note that gender and PercentChangeScore here are categorical variables because they were not specified as quantitative on the model tab. BaselineScore was specified so it shows the mean, median, etc. |
|
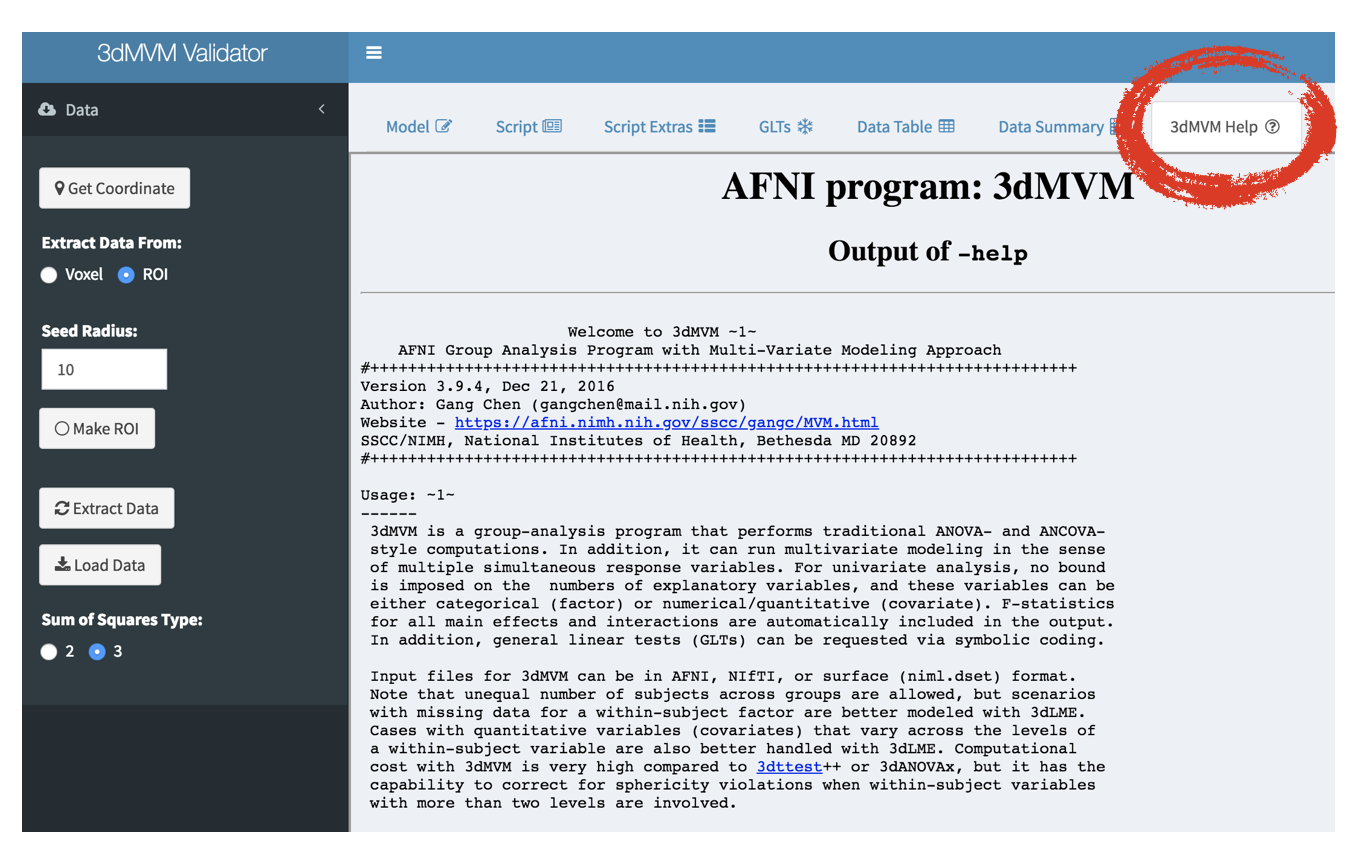
Help me if you can, I’m feeling down. [4]
The 3dMVM Help tab displays the most current version of 3dMVM’s help page for handy reference. |
|
On to GLTs!
Footnotes